13 Dover St Concord, NH 03301
Concord Heights NeighborhoodEstimated Value: $485,000 - $620,878
About This Home
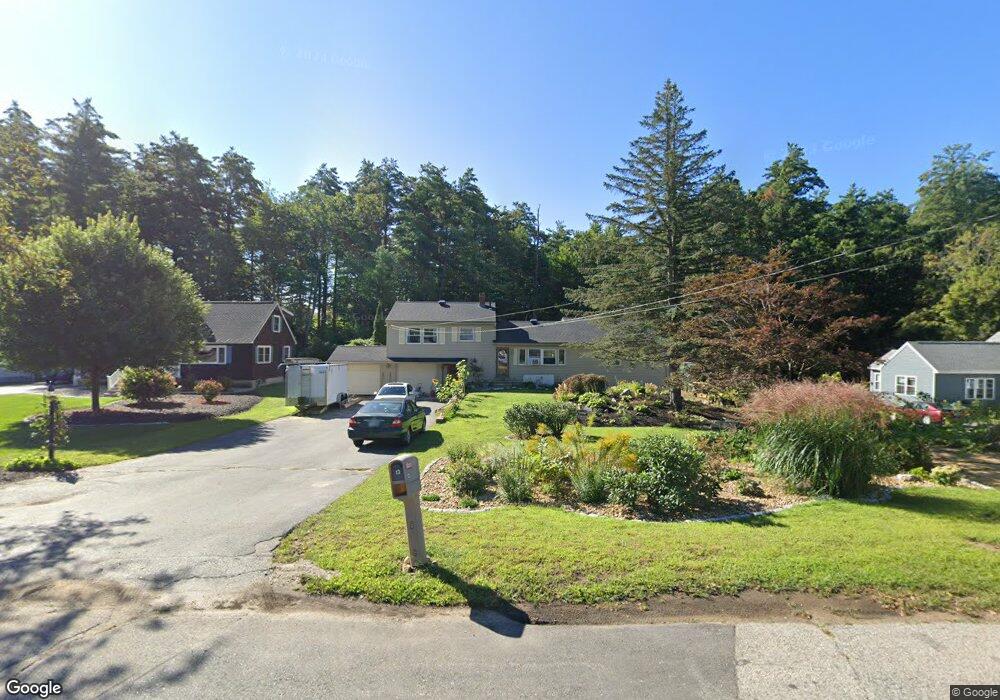
This home is located at 13 Dover St, Concord, NH 03301 and is currently estimated at $545,470, approximately $909 per square foot. 13 Dover St is a home located in Merrimack County with nearby schools including Broken Ground School, Rundlett Middle School, and Concord High School.
Ownership History
We collect this data history from publicly available records. To have your information removed, we recommend requesting removal directly through your county’s website.
Purchase Details
Home Financials for this Owner
Home Financials are based on the most recent Mortgage that was taken out on this home.Purchase Details
Home Values in the Area
Average Home Value in this Area
Purchase History
We collect this data history from publicly available records. To have your information removed, we recommend requesting removal directly through your county’s website.
| Date | Buyer | Sale Price | Title Company |
|---|---|---|---|
| -- | None Available | ||
| -- | None Available | ||
| -- | -- |
Mortgage History
We collect this data history from publicly available records. To have your information removed, we recommend requesting removal directly through your county’s website.
| Date | Status | Borrower | Loan Amount |
|---|---|---|---|
| Previous Owner | $125,000 | ||
| Previous Owner | $123,000 |
Tax History
We collect this data history from publicly available records. To have your information removed, we recommend requesting removal directly through your county’s website.
| Year | Tax Paid | Tax Assessment Tax Assessment Total Assessment is a certain percentage of the fair market value that is determined by local assessors to be the total taxable value of land and additions on the property. | Land | Improvement |
|---|---|---|---|---|
| 2025 | $10,745 | $369,100 | $118,700 | $250,400 |
| 2024 | $10,004 | $361,300 | $118,700 | $242,600 |
| 2023 | $8,687 | $323,400 | $118,700 | $204,700 |
| 2022 | $7,518 | $290,400 | $118,700 | $171,700 |
| 2021 | $7,295 | $290,400 | $118,700 | $171,700 |
| 2020 | $6,315 | $236,000 | $87,100 | $148,900 |
| 2019 | $6,264 | $225,500 | $85,500 | $140,000 |
| 2018 | $78 | $209,800 | $82,000 | $127,800 |
| 2017 | $5,730 | $202,900 | $78,100 | $124,800 |
| 2016 | $5,656 | $204,400 | $78,100 | $126,300 |
| 2015 | $4,990 | $182,500 | $78,100 | $104,400 |
| 2014 | $4,893 | $182,500 | $78,100 | $104,400 |
| 2013 | $4,668 | $182,500 | $78,100 | $104,400 |
| 2012 | $4,550 | $186,700 | $78,100 | $108,600 |
Map
- 5 Thomas St
- 2 Thomas St
- 39 Pembroke Rd
- 34 Stevens Dr
- 19 Grappone Dr
- 22 Fairfield Dr
- 12 E Side Dr Unit 406
- 12 E Side Dr Unit 2-14
- 12 E Side Dr Unit 310
- 171 Loudon Rd Unit 7
- 20 Cherry St
- 4 Eastern Ave
- 111 -113 South Main St
- 1 Peach St Unit 1
- 85 S State St
- 33-35 Chesley St
- 60 Mulberry St Unit 1
- 176 Airport Rd
- 74 S State St
- 2 Cottage Ct
Ask me questions while you tour the home.