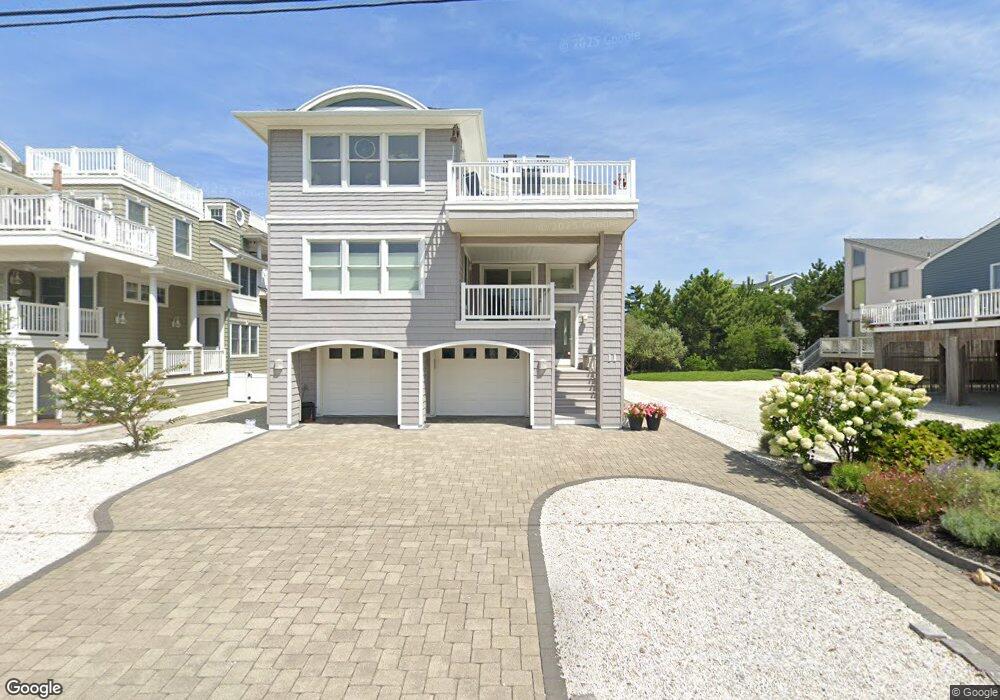
13 E 86th St Harvey Cedars, NJ 08008
Long Beach Island NeighborhoodEstimated Value: $1,758,110 - $2,408,000
2
Beds
3
Baths
3,379
Sq Ft
$636/Sq Ft
Est. Value
About This Home
This home is located at 13 E 86th St, Harvey Cedars, NJ 08008 and is currently estimated at $2,150,528, approximately $636 per square foot. 13 E 86th St is a home located in Ocean County with nearby schools including Ethel A. Jacobsen Elementary School, Long Beach Island Grade School, and Southern Regional Middle School.
Ownership History
Date
Name
Owned For
Owner Type
Purchase Details
Closed on
Feb 28, 2023
Sold by
Mossa Victor
Bought by
Mossa Victor and Dellisanti-Mossa Catherine
Current Estimated Value
Purchase Details
Closed on
Mar 21, 2011
Sold by
Mossa Victor and Dellisanti Mossa Catherine
Bought by
Mossa Victor and Dellisanti Mossa Catherine
Purchase Details
Closed on
May 29, 2009
Sold by
Mossa Catherine Delli Santi
Bought by
Mossa Victor and Santi Mossa Catherine Delli
Home Financials for this Owner
Home Financials are based on the most recent Mortgage that was taken out on this home.
Original Mortgage
$310,000
Interest Rate
4.83%
Mortgage Type
New Conventional
Purchase Details
Closed on
Apr 7, 1999
Sold by
Mossa Catherine Dellisanti
Bought by
Gerardi Angela
Purchase Details
Closed on
Aug 24, 1998
Sold by
Gerardi Angela
Bought by
Mossa Catherine Delli Santi
Create a Home Valuation Report for This Property
The Home Valuation Report is an in-depth analysis detailing your home's value as well as a comparison with similar homes in the area
Home Values in the Area
Average Home Value in this Area
Purchase History
| Date | Buyer | Sale Price | Title Company |
|---|---|---|---|
| Mossa Victor | -- | -- | |
| Mossa Victor | -- | None Listed On Document | |
| Mossa Victor | -- | Or | |
| Mossa Victor | -- | University Title Insurance A | |
| Gerardi Angela | -- | -- | |
| Mossa Catherine Delli Santi | -- | -- |
Source: Public Records
Mortgage History
| Date | Status | Borrower | Loan Amount |
|---|---|---|---|
| Previous Owner | Mossa Victor | $310,000 |
Source: Public Records
Tax History
| Year | Tax Paid | Tax Assessment Tax Assessment Total Assessment is a certain percentage of the fair market value that is determined by local assessors to be the total taxable value of land and additions on the property. | Land | Improvement |
|---|---|---|---|---|
| 2025 | $10,975 | $1,229,000 | $675,000 | $554,000 |
| 2024 | $10,901 | $1,229,000 | $675,000 | $554,000 |
Source: Public Records
Map
Nearby Homes
- 113 E Mermaid Ln
- 11 W 87th St
- 10 W Mermaid Ln
- 20 W 87th St
- 7800 Beach Ave
- 102 E Winifred (79th ) Ave
- 102 E Winifred Ave
- 25 W Bayberry Dr
- 104 E Hobart Ave
- 123 E Herbert Ave
- 103 W Jeanette Ave
- 7 E Lavenia Ave
- 3 Mea Ln
- 24 Mea Ln
- 30 W Muriel Ave
- 6601 Ocean Blvd
- 5 E Virginia Ave
- 6107 Ocean Blvd
- 6 E Colorado Ave
- 4 W Sumner Ave
- 13 E 86th St
- 7 E 86th St
- 7 E 86th St
- 7W E 86th St
- 17 E 86th St
- 19 E 86th St
- 12 E 86th Sea Glass Ln
- 20 E 85th Brighton Ave
- 8512 Beach Ave
- 22 E 86th St
- 8502 Beach Ave
- 8511 Long Beach Blvd
- 8511 Long Beach Blvd
- 8600 Beach Ave
- 11 E 87th St
- 15 E 87th St
- 2 E 86th St
- 7 E 87th St
- 8501 Long Beach Blvd Unit 4
- 8501 Long Beach Blvd Unit U10
Your Personal Tour Guide
Ask me questions while you tour the home.