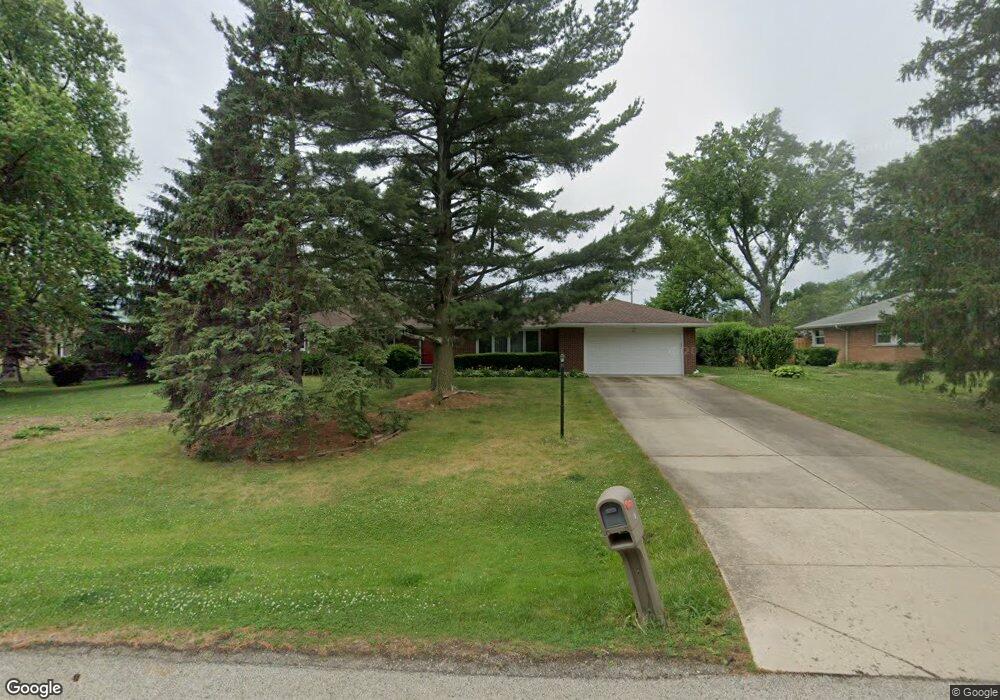
13 E Stonegate Dr Prospect Heights, IL 60070
Estimated Value: $488,321 - $528,000
4
Beds
2
Baths
2,007
Sq Ft
$256/Sq Ft
Est. Value
About This Home
This home is located at 13 E Stonegate Dr, Prospect Heights, IL 60070 and is currently estimated at $514,580, approximately $256 per square foot. 13 E Stonegate Dr is a home located in Cook County with nearby schools including Dwight D Eisenhower Elementary School, Anne Sullivan Elementary School, and Betsy Ross Elementary School.
Ownership History
Date
Name
Owned For
Owner Type
Purchase Details
Closed on
Jul 16, 2010
Sold by
Yolich Lou
Bought by
Kolodziej Michal and Pawlak Malgorzata
Current Estimated Value
Home Financials for this Owner
Home Financials are based on the most recent Mortgage that was taken out on this home.
Original Mortgage
$211,200
Outstanding Balance
$139,336
Interest Rate
4.81%
Mortgage Type
New Conventional
Estimated Equity
$375,244
Purchase Details
Closed on
Aug 10, 2009
Sold by
Roclaw William
Bought by
Yolich Lou and William Roclaw Revocable Trust
Purchase Details
Closed on
Jan 29, 1998
Sold by
Joerg Heinrich and Joerg Wilma
Bought by
Roclaw William F
Home Financials for this Owner
Home Financials are based on the most recent Mortgage that was taken out on this home.
Original Mortgage
$180,000
Interest Rate
6.37%
Create a Home Valuation Report for This Property
The Home Valuation Report is an in-depth analysis detailing your home's value as well as a comparison with similar homes in the area
Home Values in the Area
Average Home Value in this Area
Purchase History
| Date | Buyer | Sale Price | Title Company |
|---|---|---|---|
| Kolodziej Michal | $264,000 | Pntn | |
| Yolich Lou | -- | None Available | |
| Roclaw William F | $231,000 | Ticor Title |
Source: Public Records
Mortgage History
| Date | Status | Borrower | Loan Amount |
|---|---|---|---|
| Open | Kolodziej Michal | $211,200 | |
| Previous Owner | Roclaw William F | $180,000 |
Source: Public Records
Tax History
| Year | Tax Paid | Tax Assessment Tax Assessment Total Assessment is a certain percentage of the fair market value that is determined by local assessors to be the total taxable value of land and additions on the property. | Land | Improvement |
|---|---|---|---|---|
| 2025 | $10,123 | $46,000 | $19,859 | $26,141 |
| 2024 | $10,123 | $37,000 | $16,723 | $20,277 |
| 2023 | $9,462 | $37,000 | $16,723 | $20,277 |
| 2022 | $9,462 | $37,000 | $16,723 | $20,277 |
| 2021 | $9,407 | $32,021 | $13,065 | $18,956 |
| 2020 | $9,581 | $33,275 | $13,065 | $20,210 |
| 2019 | $9,519 | $37,014 | $13,065 | $23,949 |
| 2018 | $9,796 | $35,125 | $11,497 | $23,628 |
| 2017 | $9,705 | $35,125 | $11,497 | $23,628 |
| 2016 | $9,376 | $35,125 | $11,497 | $23,628 |
| 2015 | $7,546 | $26,400 | $9,929 | $16,471 |
| 2014 | $7,460 | $26,400 | $9,929 | $16,471 |
| 2013 | $7,252 | $26,400 | $9,929 | $16,471 |
Source: Public Records
Map
Nearby Homes
- 307 Anne Ct
- 802 Andover Ct
- 1125 Pleasant Run Dr Unit 807
- 1201 Pleasant Run Dr Unit 312
- 1111 Pleasant Run Dr Unit 911
- 1430 Sandstone Dr Unit 202
- 523 Bridle Trail Unit 161
- 1525 Sander Ct Unit 113
- 1105 N Maple Ln
- 1450 Sandpebble Dr Unit 333
- 1211 Highland Dr
- 448 Bridle Trail Unit 211
- 13 W Kenilworth Ave
- 2454 E Hunter Dr Unit 93
- 1014 Lakeland Ct Unit 2A
- 1025 Cottonwood Ct Unit 2AR
- 1030 Cottonwood Ct Unit 2A
- 988 Ridgefield Ln Unit 54
- 751 Garth Rd
- 2207 E Michael Manor Ln
- 15 E Stonegate Dr
- 16 S Wildwood Dr
- 14 S Wildwood Dr
- 16 E Stonegate Dr
- 18 S Wildwood Dr
- 905 Sherwood Dr
- 11 E Stonegate Dr
- 18 E Stonegate Dr
- 907 Sherwood Dr
- 11 Oakwood Dr
- 901 Sherwood Dr
- 10 E Stonegate Dr
- 17 E Stonegate Dr
- 902 E Wildwood Dr
- 904 E Wildwood Dr
- 19 S Wildwood Dr
- 17 S Wildwood Dr
- 15 S Wildwood Dr
- 21 S Wildwood Dr
- 9 Oakwood Dr
Your Personal Tour Guide
Ask me questions while you tour the home.