Estimated Value: $229,000 - $379,000
--
Bed
--
Bath
2,125
Sq Ft
$134/Sq Ft
Est. Value
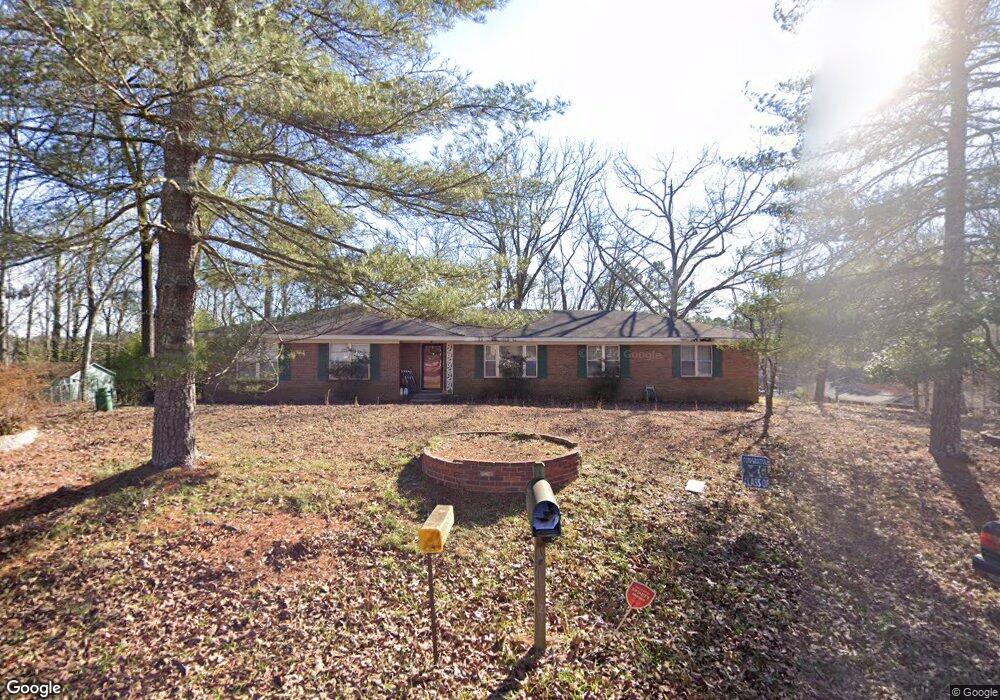
About This Home
This home is located at 13 Eastdell Rd NE, Rome, GA 30161 and is currently estimated at $283,751, approximately $133 per square foot. 13 Eastdell Rd NE is a home located in Floyd County with nearby schools including Model Middle School, Model High School, and Unity Christian School.
Ownership History
Date
Name
Owned For
Owner Type
Purchase Details
Closed on
Jul 18, 2016
Sold by
Walton Mary Sue
Bought by
Mosley Colette Reynolds
Current Estimated Value
Purchase Details
Closed on
May 13, 2014
Sold by
Reynolds Mary Sue
Bought by
Reynolds Mary Sue Estate
Purchase Details
Closed on
Aug 15, 2013
Sold by
Reynolds James F
Bought by
Reynolds Mary Sue
Purchase Details
Closed on
Nov 21, 1986
Sold by
P and R
Bought by
P and R
Purchase Details
Closed on
Jul 26, 1983
Sold by
P and R
Bought by
P and R
Purchase Details
Closed on
Jan 20, 1981
Sold by
P and R
Bought by
P and R
Purchase Details
Closed on
Jan 31, 1980
Sold by
Marvel Warren G and Marvel Georgia M
Bought by
Reynolds James F and Reynolds Mary S
Purchase Details
Closed on
Dec 15, 1977
Sold by
P and R
Bought by
P and R
Purchase Details
Closed on
Jun 15, 1968
Sold by
P and R
Bought by
P and R
Purchase Details
Closed on
Aug 9, 1963
Bought by
Ritchey Harold E
Create a Home Valuation Report for This Property
The Home Valuation Report is an in-depth analysis detailing your home's value as well as a comparison with similar homes in the area
Home Values in the Area
Average Home Value in this Area
Purchase History
| Date | Buyer | Sale Price | Title Company |
|---|---|---|---|
| Mosley Colette Reynolds | -- | -- | |
| Reynolds Mary Sue Estate | -- | -- | |
| Reynolds Mary Sue | -- | -- | |
| Reynolds Mary Sue | -- | -- | |
| P | -- | -- | |
| P | -- | -- | |
| P | -- | -- | |
| Reynolds James F | $45,700 | -- | |
| P | -- | -- | |
| P | -- | -- | |
| Ritchey Harold E | $1,200 | -- |
Source: Public Records
Tax History Compared to Growth
Tax History
| Year | Tax Paid | Tax Assessment Tax Assessment Total Assessment is a certain percentage of the fair market value that is determined by local assessors to be the total taxable value of land and additions on the property. | Land | Improvement |
|---|---|---|---|---|
| 2024 | $3,175 | $101,932 | $14,950 | $86,982 |
| 2023 | $2,916 | $83,882 | $12,650 | $71,232 |
| 2022 | $2,047 | $69,010 | $10,350 | $58,660 |
| 2021 | $1,665 | $55,173 | $10,350 | $44,823 |
| 2020 | $1,395 | $45,824 | $8,050 | $37,774 |
| 2019 | $1,304 | $43,404 | $8,050 | $35,354 |
| 2018 | $1,233 | $40,986 | $8,050 | $32,936 |
| 2017 | $1,192 | $39,522 | $8,050 | $31,472 |
| 2016 | $1,190 | $39,006 | $8,040 | $30,966 |
| 2015 | $333 | $39,006 | $8,040 | $30,966 |
| 2014 | $333 | $39,006 | $8,040 | $30,966 |
Source: Public Records
Map
Nearby Homes
- 21 Everwood Ct SE
- 406 Fred Kelly Rd NE
- 0 Fallen Branch Cir SE Unit 7397536
- 0 Fallen Branch Cir SE Unit 10311756
- 0 Fallen Branch Cir SE Unit 7234792
- 0 Fallen Branch Cir SE Unit 10172755
- 567 Fred Kelley Rd NE
- 16 Fallen Branch Cir SE
- 0 N Quarters Dr Unit 7467468
- 0 N Quarters Dr Unit 37 10390869
- 1 Outpost Trail SE
- 3 Outpost Trail SE
- 30 Mountain Creek Dr SE
- 45 Wildflower Rd NE
- 0 Mountain Creek Dr SE Unit 10436191
- 158 Sproull Rd SE
- 818 Morrison Camp Ground Rd NE
- 492 Moran Lake Rd NE
- 7 Trimble Way SE
- 0 Moran Lake Rd NE Unit 10592848
- 13 Eastdell Rd NE
- 13 Eastdell Rd NE
- 20 Eastdell Rd NE
- 19 Parkwood Cir NE
- 19 Parkwood Cir NE
- 19 Parkwood Cir NE
- 19 Parkwood Cir NE
- 15 Parkwood Cir NE Unit 32
- 15 Parkwood Cir NE
- 6 Parkwood Cir NE
- 6 Parkwood Cir NE
- 7 Eastdell Rd NE
- 13 Parkwood Cir NE
- 18 Eastdell Rd NE
- 11 Parkwood Cir NE
- 16 Eastdell Rd NE
- 14 Parkwood Cir NE
- 14 Eastdell Rd NE
- 12 Eastdell Rd NE
- 10 Eastdell Rd NE