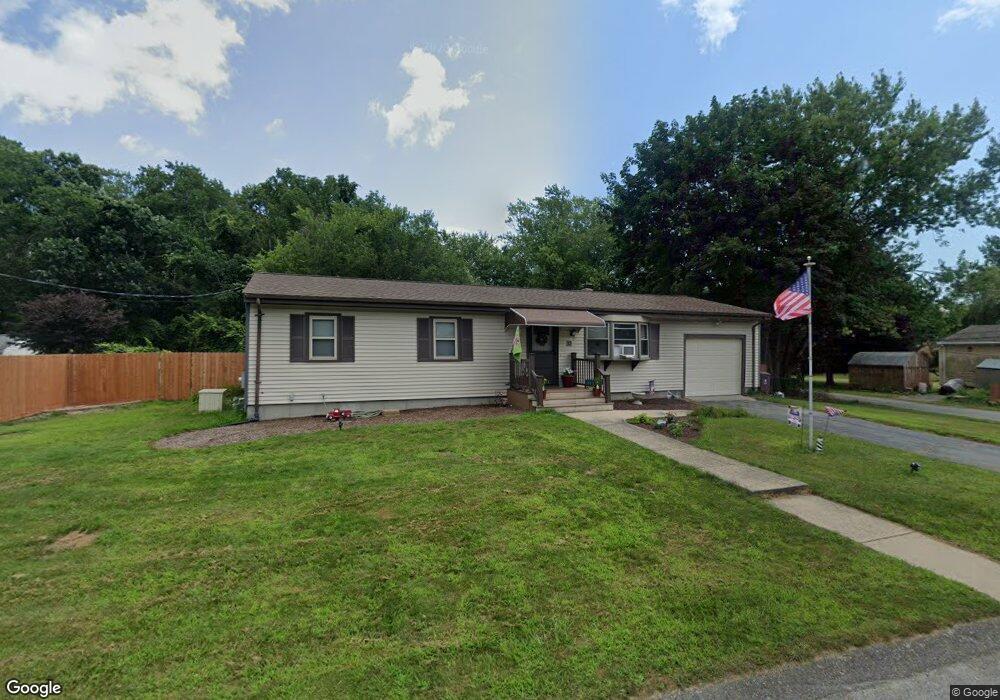
13 Elaine Way Acushnet, MA 02743
Estimated Value: $488,024 - $534,000
3
Beds
2
Baths
1,288
Sq Ft
$398/Sq Ft
Est. Value
About This Home
This home is located at 13 Elaine Way, Acushnet, MA 02743 and is currently estimated at $513,256, approximately $398 per square foot. 13 Elaine Way is a home located in Bristol County with nearby schools including Acushnet Elementary School, Albert F Ford Middle School, and Alma Del Mar Charter School.
Ownership History
Date
Name
Owned For
Owner Type
Purchase Details
Closed on
Nov 7, 2007
Sold by
Constant Laura C and Constant Robert L
Bought by
Constant Laura C and Constant Lisa M
Current Estimated Value
Purchase Details
Closed on
Jan 31, 2005
Sold by
Tavares Joseph L and Tavares Rowena D
Bought by
Constant Laura C and Constant Robert L
Home Financials for this Owner
Home Financials are based on the most recent Mortgage that was taken out on this home.
Original Mortgage
$40,000
Interest Rate
5.67%
Mortgage Type
Purchase Money Mortgage
Create a Home Valuation Report for This Property
The Home Valuation Report is an in-depth analysis detailing your home's value as well as a comparison with similar homes in the area
Home Values in the Area
Average Home Value in this Area
Purchase History
| Date | Buyer | Sale Price | Title Company |
|---|---|---|---|
| Constant Laura C | -- | -- | |
| Constant Laura C | $269,900 | -- |
Source: Public Records
Mortgage History
| Date | Status | Borrower | Loan Amount |
|---|---|---|---|
| Previous Owner | Constant Laura C | $40,000 |
Source: Public Records
Tax History Compared to Growth
Tax History
| Year | Tax Paid | Tax Assessment Tax Assessment Total Assessment is a certain percentage of the fair market value that is determined by local assessors to be the total taxable value of land and additions on the property. | Land | Improvement |
|---|---|---|---|---|
| 2025 | $43 | $396,500 | $128,100 | $268,400 |
| 2024 | $4,064 | $356,200 | $121,400 | $234,800 |
| 2023 | $3,942 | $328,500 | $110,100 | $218,400 |
| 2022 | $3,919 | $295,300 | $103,400 | $191,900 |
| 2021 | $3,770 | $272,600 | $103,400 | $169,200 |
| 2020 | $3,714 | $266,400 | $96,600 | $169,800 |
| 2019 | $3,561 | $251,100 | $92,100 | $159,000 |
| 2018 | $381 | $238,600 | $92,100 | $146,500 |
| 2017 | $3,330 | $230,600 | $92,100 | $138,500 |
| 2016 | $3,240 | $223,000 | $92,100 | $130,900 |
| 2015 | $3,073 | $215,200 | $92,100 | $123,100 |
Source: Public Records
Map
Nearby Homes