13 Everett Dr Newburyport, MA 01950
Estimated Value: $695,000 - $898,000
3
Beds
2
Baths
1,122
Sq Ft
$697/Sq Ft
Est. Value
About This Home
This home is located at 13 Everett Dr, Newburyport, MA 01950 and is currently estimated at $781,854, approximately $696 per square foot. 13 Everett Dr is a home located in Essex County with nearby schools including Francis T. Bresnahan Elementary School, Edward G. Molin Elementary School, and Rupert A. Nock Middle School.
Ownership History
Date
Name
Owned For
Owner Type
Purchase Details
Closed on
Dec 28, 2018
Sold by
Kirby Barbara A Est
Bought by
Kirby James
Current Estimated Value
Home Financials for this Owner
Home Financials are based on the most recent Mortgage that was taken out on this home.
Original Mortgage
$330,000
Outstanding Balance
$291,877
Interest Rate
4.9%
Mortgage Type
New Conventional
Estimated Equity
$489,977
Create a Home Valuation Report for This Property
The Home Valuation Report is an in-depth analysis detailing your home's value as well as a comparison with similar homes in the area
Home Values in the Area
Average Home Value in this Area
Purchase History
| Date | Buyer | Sale Price | Title Company |
|---|---|---|---|
| Kirby James | $440,000 | -- | |
| Kirby James | $440,000 | -- |
Source: Public Records
Mortgage History
| Date | Status | Borrower | Loan Amount |
|---|---|---|---|
| Open | Kirby James | $330,000 | |
| Closed | Kirby James | $330,000 |
Source: Public Records
Tax History Compared to Growth
Tax History
| Year | Tax Paid | Tax Assessment Tax Assessment Total Assessment is a certain percentage of the fair market value that is determined by local assessors to be the total taxable value of land and additions on the property. | Land | Improvement |
|---|---|---|---|---|
| 2025 | $6,796 | $709,400 | $467,600 | $241,800 |
| 2024 | $6,648 | $666,800 | $425,000 | $241,800 |
| 2023 | $6,282 | $584,900 | $369,600 | $215,300 |
| 2022 | $5,846 | $486,800 | $308,000 | $178,800 |
| 2021 | $5,296 | $419,000 | $280,000 | $139,000 |
| 2020 | $5,380 | $419,000 | $280,000 | $139,000 |
| 2019 | $5,526 | $422,500 | $280,000 | $142,500 |
| 2018 | $5,358 | $404,100 | $266,700 | $137,400 |
| 2017 | $5,180 | $385,100 | $254,100 | $131,000 |
| 2016 | $4,853 | $362,400 | $231,400 | $131,000 |
| 2015 | $4,564 | $342,100 | $231,400 | $110,700 |
Source: Public Records
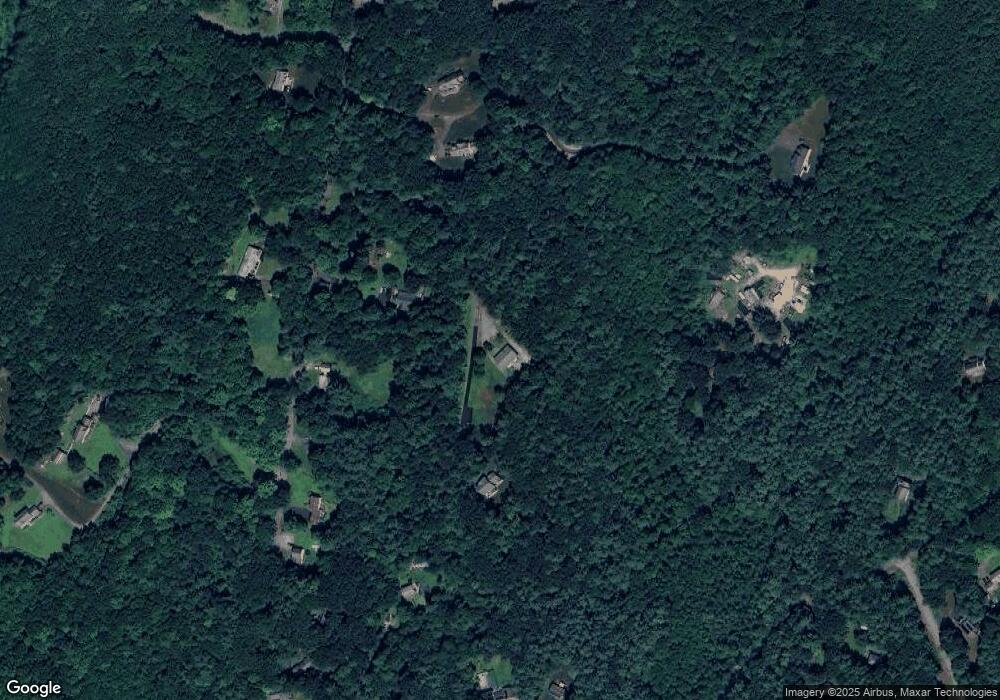
Map
Nearby Homes
- 19 Bourbeau Terrace
- 9 Everett Dr
- 8 Everett Dr
- 15 Everett Dr
- 6 Everett Dr
- 8 Chatigny Ln
- 6 Everette Dr
- 7 Everett Dr
- 16 Jones Dr
- 3 Chatigny Ln
- 14 Bourbeau Terrace
- 17 Bourbeau Terrace
- 12 Bourbeau Terrace
- 4 Everett Dr
- 6 Chatigny Ln
- 16 Bourbeau Terrace
- 19 Finnegan Way
- 9 Jones Dr
- 5 Everett Dr
- 19 Everett Dr