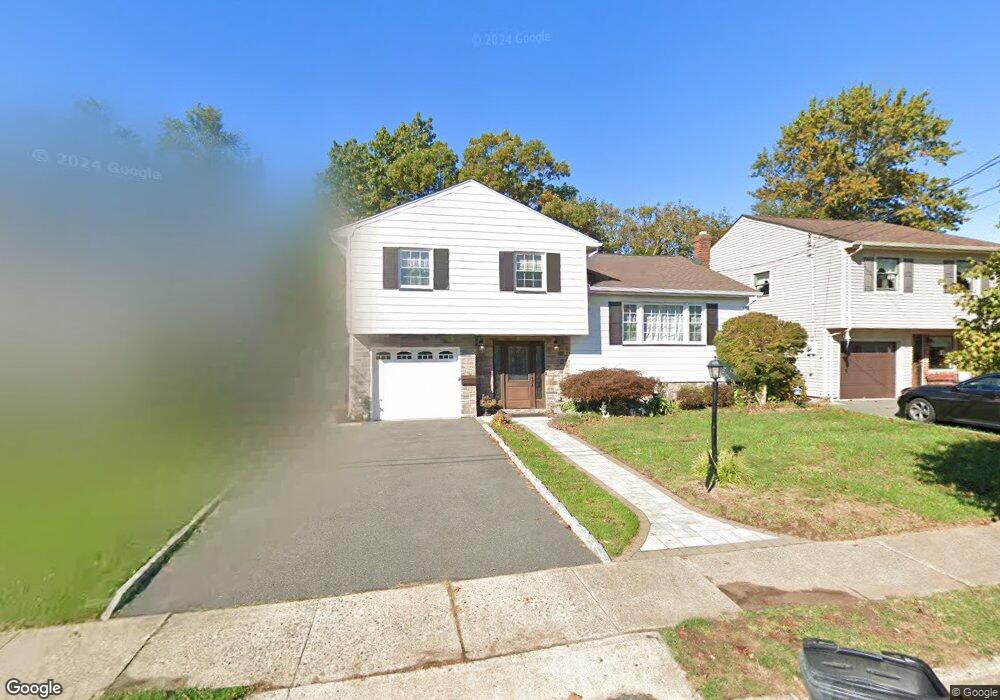
13 Faber Place Nutley, NJ 07110
Estimated Value: $611,573 - $740,000
--
Bed
--
Bath
1,508
Sq Ft
$451/Sq Ft
Est. Value
About This Home
This home is located at 13 Faber Place, Nutley, NJ 07110 and is currently estimated at $680,393, approximately $451 per square foot. 13 Faber Place is a home located in Essex County with nearby schools including Nutley High School, St. Thomas the Apostle School, and Maarif School.
Ownership History
Date
Name
Owned For
Owner Type
Purchase Details
Closed on
Sep 12, 2012
Sold by
Yi Changick and Hwang Sunsook
Bought by
Hwang Sunsook
Current Estimated Value
Purchase Details
Closed on
Jul 31, 2007
Sold by
Marchegiano John F and Marchegiano Roger
Bought by
Yi Changick and Hwang Sunsook
Home Financials for this Owner
Home Financials are based on the most recent Mortgage that was taken out on this home.
Original Mortgage
$230,000
Outstanding Balance
$37,554
Interest Rate
6.72%
Mortgage Type
Purchase Money Mortgage
Estimated Equity
$642,839
Create a Home Valuation Report for This Property
The Home Valuation Report is an in-depth analysis detailing your home's value as well as a comparison with similar homes in the area
Home Values in the Area
Average Home Value in this Area
Purchase History
| Date | Buyer | Sale Price | Title Company |
|---|---|---|---|
| Hwang Sunsook | -- | Superior Land Title Svcs Inc | |
| Yi Changick | $400,000 | Old Republic National Title |
Source: Public Records
Mortgage History
| Date | Status | Borrower | Loan Amount |
|---|---|---|---|
| Open | Yi Changick | $230,000 |
Source: Public Records
Tax History Compared to Growth
Tax History
| Year | Tax Paid | Tax Assessment Tax Assessment Total Assessment is a certain percentage of the fair market value that is determined by local assessors to be the total taxable value of land and additions on the property. | Land | Improvement |
|---|---|---|---|---|
| 2025 | $12,172 | $472,500 | $235,000 | $237,500 |
| 2024 | $12,172 | $472,500 | $235,000 | $237,500 |
| 2022 | $11,967 | $309,700 | $145,000 | $164,700 |
| 2021 | $11,905 | $309,700 | $145,000 | $164,700 |
| 2020 | $11,403 | $309,700 | $145,000 | $164,700 |
| 2019 | $11,174 | $309,700 | $145,000 | $164,700 |
| 2018 | $10,874 | $309,700 | $145,000 | $164,700 |
| 2017 | $10,756 | $309,700 | $145,000 | $164,700 |
| 2016 | $10,437 | $309,700 | $145,000 | $164,700 |
| 2015 | $10,270 | $309,700 | $145,000 | $164,700 |
| 2014 | $10,140 | $309,700 | $145,000 | $164,700 |
Source: Public Records
Map
Nearby Homes