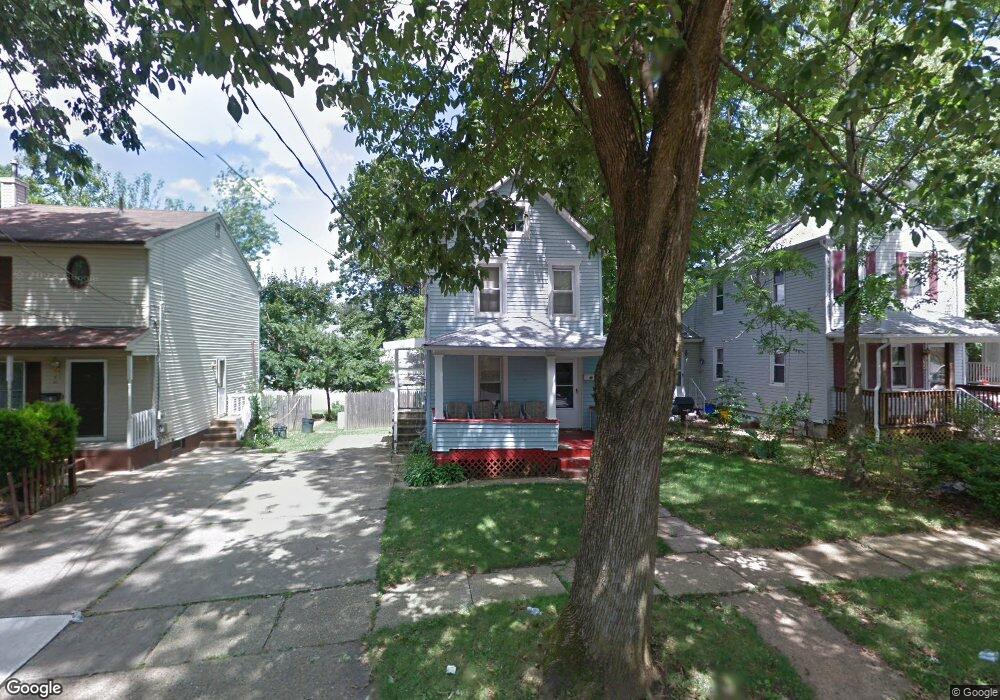
13 Factory St Freehold, NJ 07728
Estimated Value: $438,000 - $471,000
2
Beds
2
Baths
1,320
Sq Ft
$344/Sq Ft
Est. Value
About This Home
This home is located at 13 Factory St, Freehold, NJ 07728 and is currently estimated at $454,480, approximately $344 per square foot. 13 Factory St is a home located in Monmouth County with nearby schools including Park Avenue Elementary School, Freehold Intermediate School, and Freehold Borough High School.
Ownership History
Date
Name
Owned For
Owner Type
Purchase Details
Closed on
Nov 9, 2017
Sold by
Semer Properties Llc
Bought by
13 Factory St Llc
Current Estimated Value
Home Financials for this Owner
Home Financials are based on the most recent Mortgage that was taken out on this home.
Original Mortgage
$191,250
Outstanding Balance
$160,512
Interest Rate
3.91%
Mortgage Type
New Conventional
Estimated Equity
$293,968
Purchase Details
Closed on
Oct 3, 2016
Sold by
Ballard Victor
Bought by
Semer Properties Llc
Purchase Details
Closed on
Feb 29, 2008
Sold by
Taylor Jessie R
Bought by
Ballard Victor
Create a Home Valuation Report for This Property
The Home Valuation Report is an in-depth analysis detailing your home's value as well as a comparison with similar homes in the area
Home Values in the Area
Average Home Value in this Area
Purchase History
| Date | Buyer | Sale Price | Title Company |
|---|---|---|---|
| 13 Factory St Llc | -- | -- | |
| Semer Properties Llc | $90,000 | None Available | |
| Ballard Victor | -- | None Available |
Source: Public Records
Mortgage History
| Date | Status | Borrower | Loan Amount |
|---|---|---|---|
| Open | 13 Factory St Llc | $191,250 |
Source: Public Records
Tax History Compared to Growth
Tax History
| Year | Tax Paid | Tax Assessment Tax Assessment Total Assessment is a certain percentage of the fair market value that is determined by local assessors to be the total taxable value of land and additions on the property. | Land | Improvement |
|---|---|---|---|---|
| 2025 | $6,940 | $419,600 | $215,000 | $204,600 |
| 2024 | $6,989 | $345,800 | $164,700 | $181,100 |
| 2023 | $6,989 | $333,300 | $156,400 | $176,900 |
| 2022 | $5,860 | $281,100 | $120,000 | $161,100 |
| 2021 | $5,860 | $223,400 | $77,000 | $146,400 |
| 2020 | $5,769 | $216,700 | $77,000 | $139,700 |
| 2019 | $5,629 | $212,400 | $77,000 | $135,400 |
| 2018 | $5,486 | $203,100 | $77,000 | $126,100 |
| 2017 | $5,646 | $208,200 | $77,000 | $131,200 |
| 2016 | $5,060 | $190,600 | $79,000 | $111,600 |
| 2015 | $4,855 | $191,600 | $80,000 | $111,600 |
| 2014 | $5,361 | $221,600 | $110,000 | $111,600 |
Source: Public Records
Map
Nearby Homes