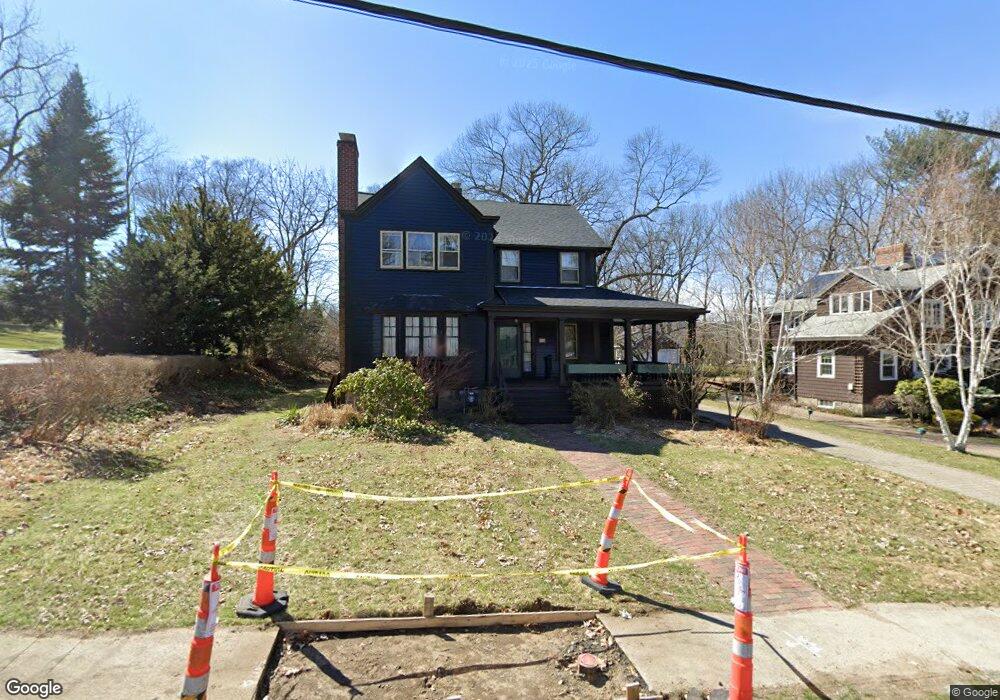
13 Fenwick Rd Winchester, MA 01890
Grove Street NeighborhoodEstimated Value: $1,498,470 - $2,442,000
3
Beds
3
Baths
2,196
Sq Ft
$848/Sq Ft
Est. Value
About This Home
This home is located at 13 Fenwick Rd, Winchester, MA 01890 and is currently estimated at $1,862,368, approximately $848 per square foot. 13 Fenwick Rd is a home located in Middlesex County with nearby schools including Ambrose Elementary School, McCall Middle School, and Winchester High School.
Ownership History
Date
Name
Owned For
Owner Type
Purchase Details
Closed on
Sep 22, 2023
Sold by
Bollinger Murray F
Bought by
Bollinger Murray F and Bollinger Maria S
Current Estimated Value
Home Financials for this Owner
Home Financials are based on the most recent Mortgage that was taken out on this home.
Original Mortgage
$500,000
Outstanding Balance
$489,396
Interest Rate
6.96%
Mortgage Type
Stand Alone Refi Refinance Of Original Loan
Estimated Equity
$1,372,972
Purchase Details
Closed on
Nov 5, 1999
Sold by
Apostolica William P
Bought by
Westropp Margaret R and Westropp Terrence J
Home Financials for this Owner
Home Financials are based on the most recent Mortgage that was taken out on this home.
Original Mortgage
$957,000
Interest Rate
7.73%
Mortgage Type
Purchase Money Mortgage
Purchase Details
Closed on
Oct 4, 1968
Bought by
Bollinger Sarah J
Create a Home Valuation Report for This Property
The Home Valuation Report is an in-depth analysis detailing your home's value as well as a comparison with similar homes in the area
Home Values in the Area
Average Home Value in this Area
Purchase History
| Date | Buyer | Sale Price | Title Company |
|---|---|---|---|
| Bollinger Murray F | -- | None Available | |
| Bollinger Murray F | -- | None Available | |
| Bollinger Sarah J | -- | -- | |
| Westropp Margaret R | $1,276,000 | -- |
Source: Public Records
Mortgage History
| Date | Status | Borrower | Loan Amount |
|---|---|---|---|
| Open | Bollinger Murray F | $500,000 | |
| Previous Owner | Bollinger Sarah J | $957,000 |
Source: Public Records
Tax History
| Year | Tax Paid | Tax Assessment Tax Assessment Total Assessment is a certain percentage of the fair market value that is determined by local assessors to be the total taxable value of land and additions on the property. | Land | Improvement |
|---|---|---|---|---|
| 2025 | $151 | $1,364,700 | $937,000 | $427,700 |
| 2024 | $15,094 | $1,332,200 | $937,000 | $395,200 |
| 2023 | $14,346 | $1,215,800 | $824,600 | $391,200 |
| 2022 | $14,015 | $1,120,300 | $749,600 | $370,700 |
| 2021 | $13,411 | $1,045,300 | $674,600 | $370,700 |
| 2020 | $12,951 | $1,045,300 | $674,600 | $370,700 |
| 2019 | $9,745 | $970,400 | $599,700 | $370,700 |
| 2018 | $9,592 | $902,100 | $541,600 | $360,500 |
| 2017 | $9,339 | $805,700 | $465,700 | $340,000 |
| 2016 | $9,200 | $787,700 | $438,500 | $349,200 |
| 2015 | $9,405 | $774,700 | $438,500 | $336,200 |
| 2014 | $8,744 | $690,700 | $365,400 | $325,300 |
Source: Public Records
Map
Nearby Homes
Your Personal Tour Guide
Ask me questions while you tour the home.