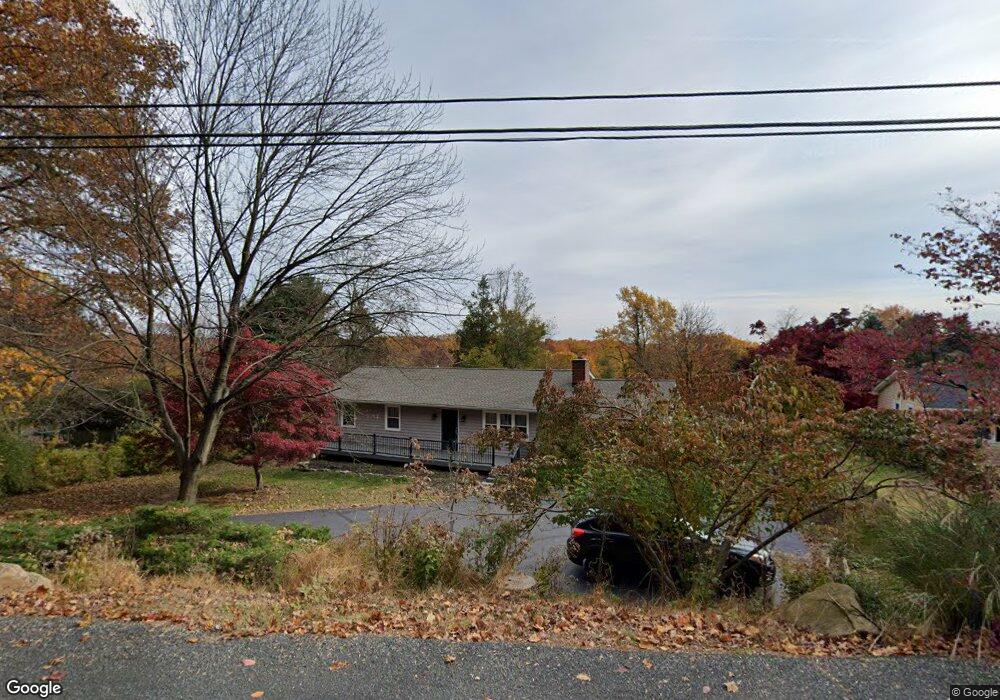
13 Fine Rd High Bridge, NJ 08829
Estimated Value: $357,000 - $488,000
--
Bed
--
Bath
1,242
Sq Ft
$346/Sq Ft
Est. Value
About This Home
This home is located at 13 Fine Rd, High Bridge, NJ 08829 and is currently estimated at $429,159, approximately $345 per square foot. 13 Fine Rd is a home located in Hunterdon County with nearby schools including High Bridge Elementary School, High Bridge Middle School, and Voorhees High School.
Ownership History
Date
Name
Owned For
Owner Type
Purchase Details
Closed on
Aug 26, 2002
Sold by
Carmouche Sharon L
Bought by
Stabile Jill M and Rechowicz James J
Current Estimated Value
Home Financials for this Owner
Home Financials are based on the most recent Mortgage that was taken out on this home.
Original Mortgage
$235,500
Outstanding Balance
$100,098
Interest Rate
6.48%
Estimated Equity
$329,061
Purchase Details
Closed on
Mar 28, 1995
Sold by
Milewski Sharon Lee and Walter Sharon Lee
Bought by
Milewski Sharon Lee and Walter Sharon Lee
Create a Home Valuation Report for This Property
The Home Valuation Report is an in-depth analysis detailing your home's value as well as a comparison with similar homes in the area
Home Values in the Area
Average Home Value in this Area
Purchase History
| Date | Buyer | Sale Price | Title Company |
|---|---|---|---|
| Stabile Jill M | $266,500 | -- | |
| Milewski Sharon Lee | -- | -- |
Source: Public Records
Mortgage History
| Date | Status | Borrower | Loan Amount |
|---|---|---|---|
| Open | Stabile Jill M | $235,500 |
Source: Public Records
Tax History Compared to Growth
Tax History
| Year | Tax Paid | Tax Assessment Tax Assessment Total Assessment is a certain percentage of the fair market value that is determined by local assessors to be the total taxable value of land and additions on the property. | Land | Improvement |
|---|---|---|---|---|
| 2025 | $10,203 | $291,800 | $171,500 | $120,300 |
| 2024 | $9,557 | $312,600 | $130,700 | $181,900 |
| 2023 | $9,557 | $241,700 | $106,900 | $134,800 |
| 2022 | $8,710 | $204,700 | $101,900 | $102,800 |
| 2021 | $8,543 | $205,100 | $101,900 | $103,200 |
| 2020 | $8,442 | $205,900 | $101,900 | $104,000 |
| 2019 | $8,543 | $206,800 | $101,900 | $104,900 |
| 2018 | $9,210 | $232,400 | $101,500 | $130,900 |
| 2017 | $9,053 | $234,900 | $101,500 | $133,400 |
| 2016 | $8,947 | $234,900 | $101,500 | $133,400 |
| 2015 | $8,705 | $234,900 | $101,500 | $133,400 |
| 2014 | $8,401 | $245,000 | $168,800 | $76,200 |
Source: Public Records
Map
Nearby Homes