J
Seller's Agent in 2025
Jermaine Hurley
Cameron Prestige, LLC
(781) 486-3180
46 Total Sales
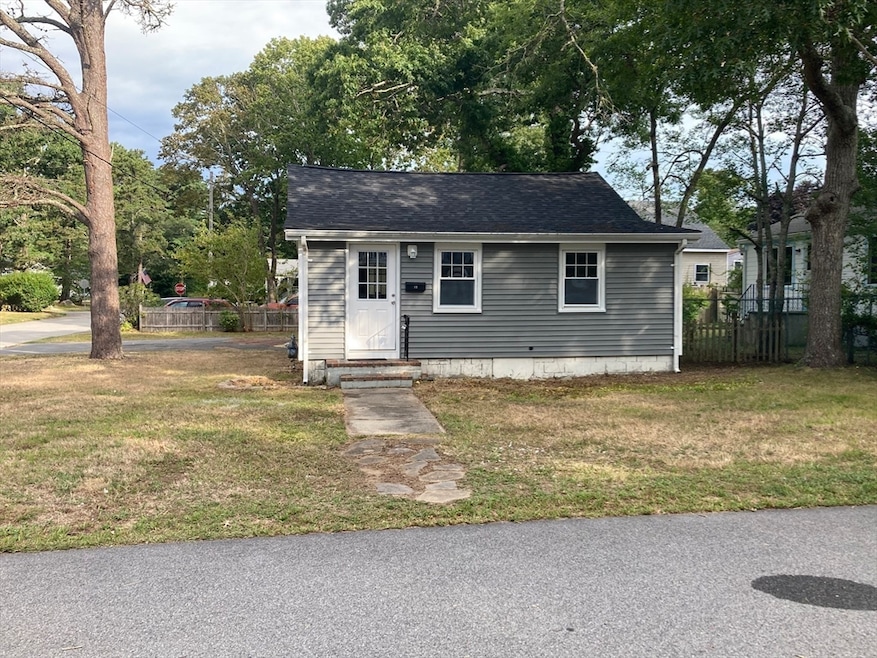


Property is in Highest and Best Offer by Monday 5PM. No Escalation Clauses. Located in the desirable Parkwood Beach Community. Remodeled one level two bedroom 1 bathroom home with a bonus room that could be used as a guest room, office or extra living area. New granite countertops, stainless steel appliances and new carpets in the bedrooms. Freshly painted with modern grey color throughout the home. High efficiency Navien Heater system. Home includes a brand new roof and modern grey vinyl siding. Just a few blocks away from the water and access to two private beaches for swimming, fishing and canoeing.
| Date | Type | Sale Price | Title Company |
|---|---|---|---|
| Quit Claim Deed | $364,000 | -- | |
| Quit Claim Deed | $235,000 | -- | |
| Quit Claim Deed | $235,000 | -- | |
| Deed | $169,900 | -- | |
| Deed | $169,900 | -- |
| Date | Status | Loan Amount | Loan Type |
|---|---|---|---|
| Open | $328,700 | New Conventional | |
| Previous Owner | $50,000 | No Value Available | |
| Previous Owner | $20,000 | Purchase Money Mortgage |
| Date | Event | Price | List to Sale | Price per Sq Ft |
|---|---|---|---|---|
| 10/06/2025 10/06/25 | Sold | $364,000 | +13.8% | $469 / Sq Ft |
| 09/02/2025 09/02/25 | Pending | -- | -- | -- |
| 08/29/2025 08/29/25 | For Sale | $319,900 | -- | $412 / Sq Ft |
| Year | Tax Paid | Tax Assessment Tax Assessment Total Assessment is a certain percentage of the fair market value that is determined by local assessors to be the total taxable value of land and additions on the property. | Land | Improvement |
|---|---|---|---|---|
| 2025 | $2,753 | $264,200 | $120,800 | $143,400 |
| 2024 | $2,755 | $245,300 | $92,700 | $152,600 |
| 2023 | $2,459 | $218,500 | $84,200 | $134,300 |
| 2022 | $2,459 | $186,600 | $84,200 | $102,400 |
| 2021 | $2,317 | $172,300 | $84,200 | $88,100 |
| 2020 | $2,210 | $166,700 | $84,200 | $82,500 |
| 2019 | $2,241 | $168,600 | $76,400 | $92,200 |
| 2018 | $2,185 | $160,300 | $76,400 | $83,900 |
| 2017 | $2,039 | $151,600 | $76,400 | $75,200 |
| 2016 | $1,813 | $134,000 | $69,300 | $64,700 |
| 2015 | $1,751 | $134,000 | $69,300 | $64,700 |
| 2014 | $1,723 | $134,100 | $75,600 | $58,500 |
J
Seller's Agent in 2025
Jermaine Hurley
Cameron Prestige, LLC
(781) 486-3180
46 Total Sales

Buyer's Agent in 2025
Kim Sullivan
Insight Realty Group, Inc.
(617) 519-9803
14 Total Sales
Source: MLS Property Information Network (MLS PIN)
MLS Number: 73423291
APN: WARE-000038-000000-000261
Disclaimer: Certain information contained herein is derived from information provided by parties other than Homes.com. All information provided is deemed reliable, but is not guaranteed to be accurate and should be independently verified.
![]() The property listing data and information, or the Images, set forth herein were provided to MLS Property Information Network, Inc. from third party sources, including sellers, lessors and public records, and were compiled by MLS Property Information Network, Inc. The property listing data and information, and the Images, are for the personal, non-commercial use of consumers having a good faith interest in purchasing or leasing listed properties of the type displayed to them and may not be used for any purpose other than to identify prospective properties which such consumers may have a good faith interest in purchasing or leasing. MLS Property Information Network, Inc. and its subscribers disclaim any and all representations and warranties as to the accuracy of the property listing data and information, or as to the accuracy of any of the Images, set forth herein.
The property listing data and information, or the Images, set forth herein were provided to MLS Property Information Network, Inc. from third party sources, including sellers, lessors and public records, and were compiled by MLS Property Information Network, Inc. The property listing data and information, and the Images, are for the personal, non-commercial use of consumers having a good faith interest in purchasing or leasing listed properties of the type displayed to them and may not be used for any purpose other than to identify prospective properties which such consumers may have a good faith interest in purchasing or leasing. MLS Property Information Network, Inc. and its subscribers disclaim any and all representations and warranties as to the accuracy of the property listing data and information, or as to the accuracy of any of the Images, set forth herein.
Ask me questions while you tour the home.