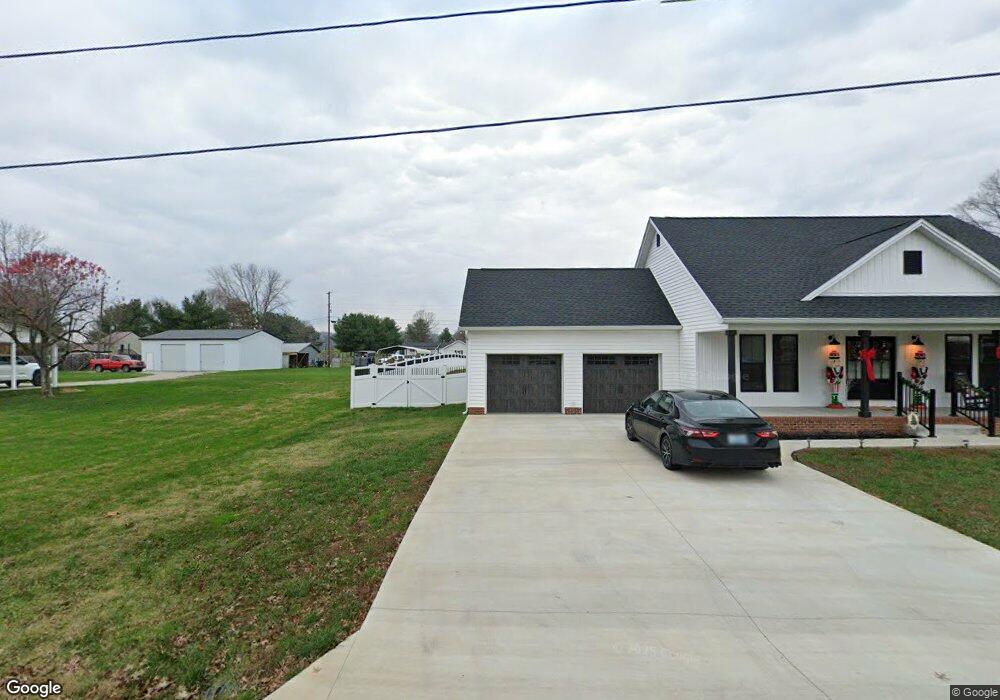
13 Fourth St South Shore, KY 41175
Estimated Value: $286,000 - $343,769
3
Beds
2
Baths
1,856
Sq Ft
$175/Sq Ft
Est. Value
About This Home
This home is located at 13 Fourth St, South Shore, KY 41175 and is currently estimated at $324,692, approximately $174 per square foot. 13 Fourth St is a home located in Greenup County with nearby schools including Greenup County High School.
Ownership History
Date
Name
Owned For
Owner Type
Purchase Details
Closed on
Feb 15, 2024
Sold by
Karasik Gregory and Karasik Jamie
Bought by
Hall Jimmy and Smith Carrie
Current Estimated Value
Home Financials for this Owner
Home Financials are based on the most recent Mortgage that was taken out on this home.
Original Mortgage
$256,000
Outstanding Balance
$251,215
Interest Rate
6.6%
Mortgage Type
Construction
Estimated Equity
$73,477
Purchase Details
Closed on
Aug 20, 2021
Sold by
Greenup County
Bought by
Williams Jeffrey Allen and Williams Kelsey Jo
Purchase Details
Closed on
Nov 4, 2016
Sold by
Dillow Donald R
Bought by
Dillow Gregory Scott and Dillow Amy Jo
Purchase Details
Closed on
Nov 1, 2014
Sold by
G S Dillow Construction And Designs Llc
Bought by
Dillow Donald R
Create a Home Valuation Report for This Property
The Home Valuation Report is an in-depth analysis detailing your home's value as well as a comparison with similar homes in the area
Purchase History
| Date | Buyer | Sale Price | Title Company |
|---|---|---|---|
| Hall Jimmy | $325,000 | None Listed On Document | |
| Williams Jeffrey Allen | -- | None Listed On Document | |
| Dillow Gregory Scott | $23,000 | Attorney | |
| Dillow Donald R | $8,000 | Attorney |
Source: Public Records
Mortgage History
| Date | Status | Borrower | Loan Amount |
|---|---|---|---|
| Open | Hall Jimmy | $256,000 |
Source: Public Records
Tax History
| Year | Tax Paid | Tax Assessment Tax Assessment Total Assessment is a certain percentage of the fair market value that is determined by local assessors to be the total taxable value of land and additions on the property. | Land | Improvement |
|---|---|---|---|---|
| 2025 | $5,538 | $325,000 | $25,000 | $300,000 |
| 2024 | -- | $325,000 | $25,000 | $300,000 |
| 2023 | $369 | $289,000 | $25,000 | $264,000 |
| 2022 | $358 | $23,000 | $23,000 | $0 |
| 2021 | $356 | $23,000 | $23,000 | $0 |
| 2020 | $351 | $23,000 | $23,000 | $0 |
| 2019 | $354 | $23,000 | $23,000 | $0 |
| 2018 | $362 | $23,000 | $23,000 | $0 |
| 2017 | $303 | $23,000 | $23,000 | $0 |
| 2016 | $303 | $20,000 | $20,000 | $0 |
| 2015 | $301 | $20,000 | $20,000 | $0 |
| 2014 | $2,708 | $181,524 | $65,000 | $116,524 |
Source: Public Records
Map
Nearby Homes
- 3748 Stanton Ave
- 3221 Rhodes Ave
- 199 James E Hannah Dr
- 0 Glenwood Ave
- 605 Glenwood Ave
- 534 Hill Rd
- 3015 Gallia St
- 1381 Kentucky 7
- 2 E 3rd Ave
- 159 E Third Avenue (Blue)
- 159 E Third Avenue (Tan)
- 175 E 3rd Ave
- 45 W 3rd Ave
- 4123 Hill Rd
- 607 Sycamore St
- 447 Bloom St
- 1324 Center St
- 2116 Canter Dr
- 5544 Wilson Ave
- 1423 Center St
Your Personal Tour Guide
Ask me questions while you tour the home.