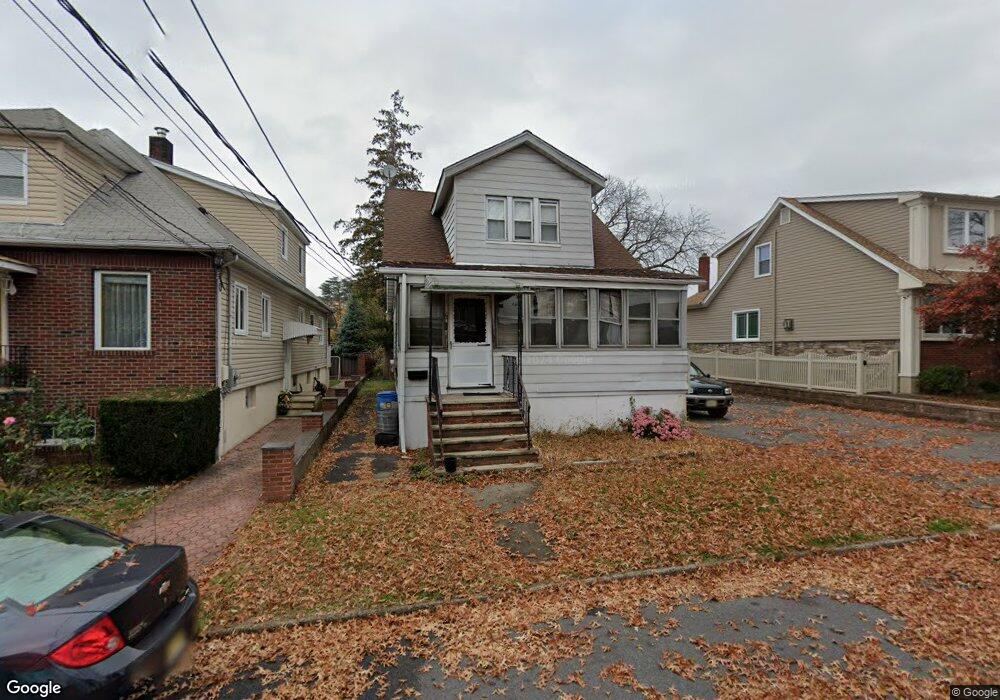
13 Fradkin St Unit 2 Wallington, NJ 07057
Estimated Value: $735,000 - $1,100,000
3
Beds
2
Baths
1,196
Sq Ft
$828/Sq Ft
Est. Value
About This Home
This home is located at 13 Fradkin St Unit 2, Wallington, NJ 07057 and is currently estimated at $990,228, approximately $827 per square foot. 13 Fradkin St Unit 2 is a home located in Bergen County with nearby schools including Wallington Jr Sr High School and Montessori School of East Rutherford.
Ownership History
Date
Name
Owned For
Owner Type
Purchase Details
Closed on
Apr 24, 2024
Sold by
Gusciora Savy
Bought by
Ulloa-Jordan Kevin A
Current Estimated Value
Home Financials for this Owner
Home Financials are based on the most recent Mortgage that was taken out on this home.
Original Mortgage
$807,500
Outstanding Balance
$795,227
Interest Rate
6.79%
Mortgage Type
New Conventional
Estimated Equity
$195,001
Purchase Details
Closed on
May 8, 2023
Sold by
Kurpiewski Artur
Bought by
Gusciora Savy
Purchase Details
Closed on
Mar 30, 2022
Sold by
Stanley Ziptko Jr
Bought by
Kurpiewski Artur
Home Financials for this Owner
Home Financials are based on the most recent Mortgage that was taken out on this home.
Original Mortgage
$320,000
Interest Rate
4.42%
Mortgage Type
New Conventional
Purchase Details
Closed on
Aug 23, 2012
Sold by
Ziptko Fred and Ziptko Richard
Bought by
Ziptko Fred and Ziptko Alicia
Create a Home Valuation Report for This Property
The Home Valuation Report is an in-depth analysis detailing your home's value as well as a comparison with similar homes in the area
Home Values in the Area
Average Home Value in this Area
Purchase History
| Date | Buyer | Sale Price | Title Company |
|---|---|---|---|
| Ulloa-Jordan Kevin A | $1,020,000 | None Listed On Document | |
| Ulloa-Jordan Kevin A | $1,020,000 | None Listed On Document | |
| Gusciora Savy | $450,000 | Chicago Title | |
| Gusciora Savy | $450,000 | Chicago Title | |
| Kurpiewski Artur | $400,000 | Chicago Title | |
| Ziptko Fred | $23,524 | -- |
Source: Public Records
Mortgage History
| Date | Status | Borrower | Loan Amount |
|---|---|---|---|
| Open | Ulloa-Jordan Kevin A | $807,500 | |
| Closed | Ulloa-Jordan Kevin A | $807,500 | |
| Previous Owner | Kurpiewski Artur | $320,000 |
Source: Public Records
Tax History Compared to Growth
Tax History
| Year | Tax Paid | Tax Assessment Tax Assessment Total Assessment is a certain percentage of the fair market value that is determined by local assessors to be the total taxable value of land and additions on the property. | Land | Improvement |
|---|---|---|---|---|
| 2025 | $8,642 | $987,700 | $326,000 | $661,700 |
| 2024 | $8,314 | $254,100 | $185,700 | $68,400 |
| 2023 | $8,141 | $254,100 | $185,700 | $68,400 |
| 2022 | $8,141 | $254,100 | $185,700 | $68,400 |
| 2021 | $7,562 | $254,100 | $185,700 | $68,400 |
| 2020 | $7,839 | $254,100 | $185,700 | $68,400 |
| 2019 | $7,590 | $254,100 | $185,700 | $68,400 |
| 2018 | $7,501 | $254,100 | $185,700 | $68,400 |
| 2017 | $7,407 | $254,100 | $185,700 | $68,400 |
| 2016 | $7,262 | $254,100 | $185,700 | $68,400 |
| 2015 | $6,952 | $254,100 | $185,700 | $68,400 |
| 2014 | $6,596 | $254,100 | $185,700 | $68,400 |
Source: Public Records
Map
Nearby Homes
- 62 Johnson Ave
- 11 Roehrs Dr
- 29 Mount Pleasant Ave
- 15 Morrissee Ave
- 147 14th St
- 36 Pulaski Ave
- 94 Locust Ave
- 152 Helm Ave
- 34 William St
- 69 Kossuth St
- 25 Pulaski Ave Unit A
- 25 Pulaski Ave Unit B
- 25 Pulaski Ave
- 148 12th St
- 271 North Ave
- 592 Central Ave
- 3 Ross Rd
- 196 Hayward Place
- 4 Crescent Rd
- 289 Bradley Dr
- 13 Fradkin St
- 17 Fradkin St
- 11 Fradkin St
- 21 Fradkin St
- 232 Alden St
- 190 Mount Pleasant Ave
- 186 Mount Pleasant Ave
- 196 Mount Pleasant Ave
- 27 Fradkin St
- 14 Fradkin St
- 18 Fradkin St
- 12 Fradkin St
- 236 Alden St
- 178 Mount Pleasant Ave
- 22 Fradkin St
- 228 Alden St
- 33 Fradkin St
- 202 Mount Pleasant Ave
- 26 Fradkin St
- 174 Mt Pleasant Ave