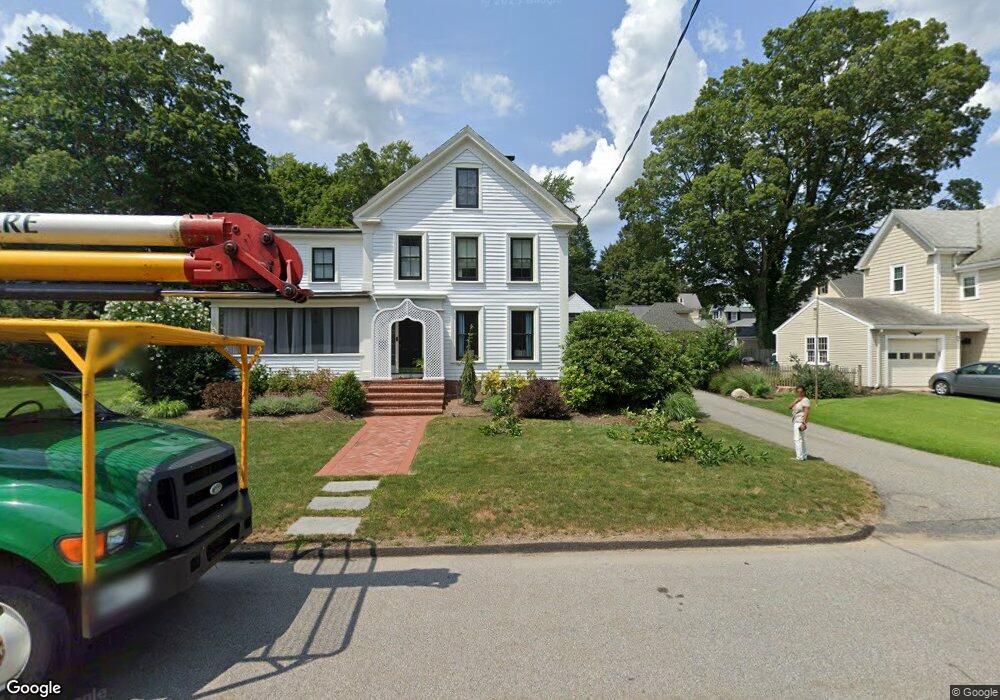
13 Fremont St Reading, MA 01867
Estimated Value: $1,126,000 - $1,336,474
5
Beds
2
Baths
3,155
Sq Ft
$382/Sq Ft
Est. Value
About This Home
This home is located at 13 Fremont St, Reading, MA 01867 and is currently estimated at $1,205,369, approximately $382 per square foot. 13 Fremont St is a home located in Middlesex County with nearby schools including Alice M. Barrows Elementary School, Walter S. Parker Middle School, and Reading Memorial High School.
Ownership History
Date
Name
Owned For
Owner Type
Purchase Details
Closed on
May 27, 2014
Sold by
Sinnatamby Earle J and Sinnatamby Sumithra N
Bought by
Sumithra N Sinnatamby N and Sumithra Sinnatamby
Current Estimated Value
Create a Home Valuation Report for This Property
The Home Valuation Report is an in-depth analysis detailing your home's value as well as a comparison with similar homes in the area
Home Values in the Area
Average Home Value in this Area
Purchase History
| Date | Buyer | Sale Price | Title Company |
|---|---|---|---|
| Sumithra N Sinnatamby N | -- | -- |
Source: Public Records
Tax History Compared to Growth
Tax History
| Year | Tax Paid | Tax Assessment Tax Assessment Total Assessment is a certain percentage of the fair market value that is determined by local assessors to be the total taxable value of land and additions on the property. | Land | Improvement |
|---|---|---|---|---|
| 2025 | $13,020 | $1,143,100 | $628,800 | $514,300 |
| 2024 | $12,637 | $1,078,200 | $592,800 | $485,400 |
| 2023 | $12,577 | $999,000 | $548,900 | $450,100 |
| 2022 | $12,118 | $909,100 | $499,000 | $410,100 |
| 2021 | $11,520 | $834,200 | $457,900 | $376,300 |
| 2020 | $7,529 | $818,300 | $449,100 | $369,200 |
| 2019 | $11,082 | $778,800 | $427,200 | $351,600 |
| 2018 | $4,346 | $735,200 | $403,100 | $332,100 |
| 2017 | $9,902 | $705,800 | $383,900 | $321,900 |
| 2016 | $8,891 | $613,200 | $326,700 | $286,500 |
| 2015 | $8,658 | $589,000 | $301,900 | $287,100 |
| 2014 | $8,470 | $574,600 | $291,700 | $282,900 |
Source: Public Records
Map
Nearby Homes
- 266 West St
- 101 King St Unit 101
- 17 Palmer Hill Ave
- 18 Wescroft Rd
- 57 Wescroft Rd
- 175 West St
- 16 Munroe Ave
- 5 Washington St Unit B2
- 103 High St
- 75 Johnson Woods Dr Unit 75
- 77 Mount Vernon St
- 18 Talbot Ln Unit 18
- 16 Taylor Dr Unit 1010
- 16 Taylor Dr Unit 1009
- 141 Johnson Woods Dr
- 144 Johnson Woods Dr
- 195 Lowell St
- 35 Park Ave
- 24 Minot St
- 42 Winthrop Ave