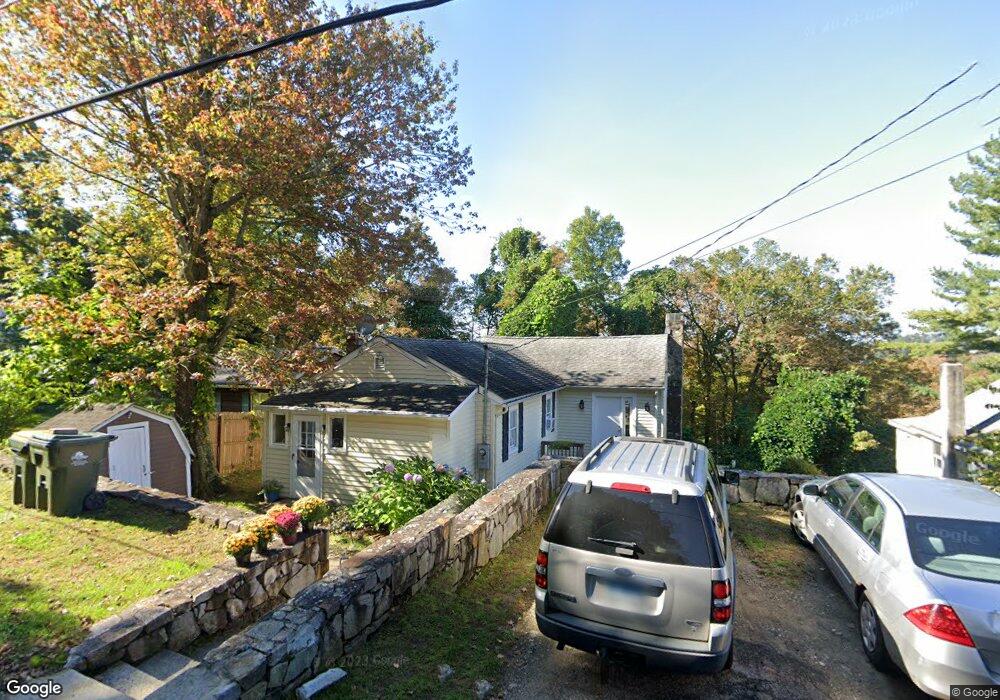
13 Fulton Dr New Fairfield, CT 06812
Estimated Value: $289,000 - $371,000
3
Beds
2
Baths
1,140
Sq Ft
$298/Sq Ft
Est. Value
About This Home
This home is located at 13 Fulton Dr, New Fairfield, CT 06812 and is currently estimated at $339,762, approximately $298 per square foot. 13 Fulton Dr is a home located in Fairfield County with nearby schools including Meeting House Hill School, New Fairfield Middle School, and New Fairfield High School.
Ownership History
Date
Name
Owned For
Owner Type
Purchase Details
Closed on
Mar 19, 2008
Sold by
Hsbc Mortgage Svcs Inc
Bought by
Hull Kristen A
Current Estimated Value
Home Financials for this Owner
Home Financials are based on the most recent Mortgage that was taken out on this home.
Original Mortgage
$143,920
Outstanding Balance
$89,708
Interest Rate
5.75%
Estimated Equity
$250,054
Purchase Details
Closed on
Sep 3, 1999
Sold by
Cleary Joseph F
Bought by
Schimanskey Paul A
Home Financials for this Owner
Home Financials are based on the most recent Mortgage that was taken out on this home.
Original Mortgage
$92,280
Interest Rate
7.5%
Create a Home Valuation Report for This Property
The Home Valuation Report is an in-depth analysis detailing your home's value as well as a comparison with similar homes in the area
Home Values in the Area
Average Home Value in this Area
Purchase History
| Date | Buyer | Sale Price | Title Company |
|---|---|---|---|
| Hull Kristen A | $179,000 | -- | |
| Schimanskey Paul A | $95,000 | -- |
Source: Public Records
Mortgage History
| Date | Status | Borrower | Loan Amount |
|---|---|---|---|
| Open | Schimanskey Paul A | $143,920 | |
| Previous Owner | Schimanskey Paul A | $219,000 | |
| Previous Owner | Schimanskey Paul A | $89,775 | |
| Previous Owner | Schimanskey Paul A | $92,280 |
Source: Public Records
Tax History Compared to Growth
Tax History
| Year | Tax Paid | Tax Assessment Tax Assessment Total Assessment is a certain percentage of the fair market value that is determined by local assessors to be the total taxable value of land and additions on the property. | Land | Improvement |
|---|---|---|---|---|
| 2025 | $4,829 | $183,400 | $67,600 | $115,800 |
| 2024 | $4,189 | $114,700 | $66,200 | $48,500 |
| 2023 | $4,003 | $114,700 | $66,200 | $48,500 |
| 2022 | $3,724 | $114,700 | $66,200 | $48,500 |
| 2021 | $0 | $114,700 | $66,200 | $48,500 |
| 2020 | $3,508 | $114,700 | $66,200 | $48,500 |
| 2019 | $5,582 | $102,200 | $54,000 | $48,200 |
| 2018 | $3,125 | $102,200 | $54,000 | $48,200 |
| 2017 | $5,433 | $102,200 | $54,000 | $48,200 |
| 2016 | $2,931 | $102,200 | $54,000 | $48,200 |
| 2015 | $2,931 | $102,200 | $54,000 | $48,200 |
| 2014 | $2,861 | $109,700 | $59,600 | $50,100 |
Source: Public Records
Map
Nearby Homes