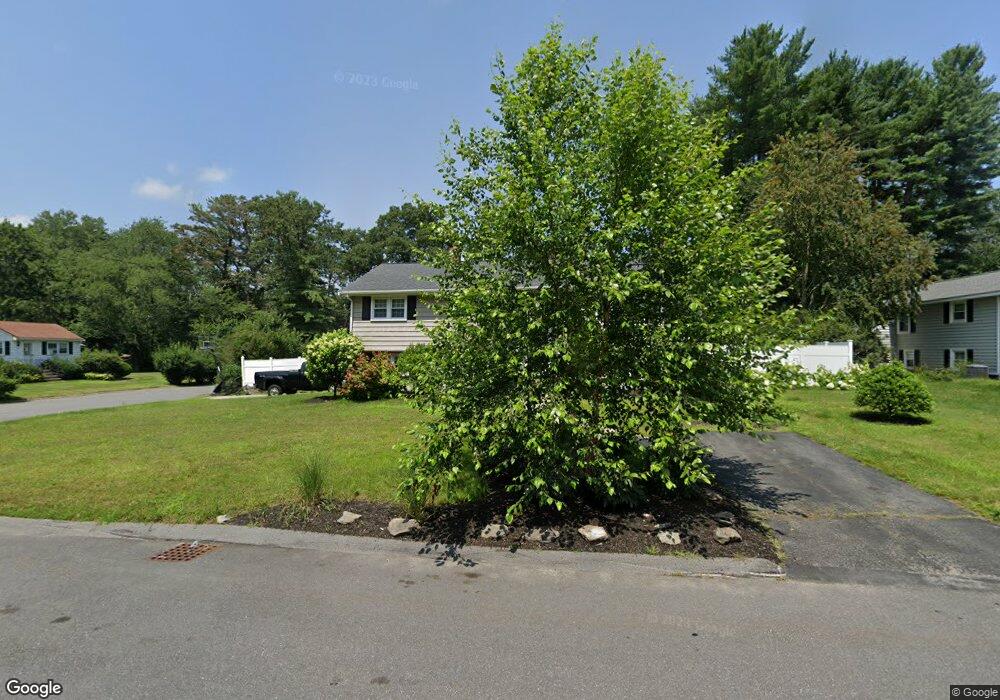
13 Gedick Rd Burlington, MA 01803
North Burlington NeighborhoodEstimated Value: $815,000 - $879,000
3
Beds
2
Baths
1,803
Sq Ft
$468/Sq Ft
Est. Value
About This Home
This home is located at 13 Gedick Rd, Burlington, MA 01803 and is currently estimated at $844,552, approximately $468 per square foot. 13 Gedick Rd is a home located in Middlesex County with nearby schools including Burlington High School, Fox Hill, and Marshall Simonds Middle School.
Ownership History
Date
Name
Owned For
Owner Type
Purchase Details
Closed on
Nov 22, 2004
Sold by
Doyle David A and Mogan Martha A
Bought by
Spyridridopul Konstantina
Current Estimated Value
Home Financials for this Owner
Home Financials are based on the most recent Mortgage that was taken out on this home.
Original Mortgage
$300,000
Outstanding Balance
$149,909
Interest Rate
5.8%
Mortgage Type
Purchase Money Mortgage
Estimated Equity
$694,643
Purchase Details
Closed on
Apr 29, 1987
Sold by
Nicholas James L
Bought by
Ooyle David A
Home Financials for this Owner
Home Financials are based on the most recent Mortgage that was taken out on this home.
Original Mortgage
$177,000
Interest Rate
8.99%
Mortgage Type
Purchase Money Mortgage
Create a Home Valuation Report for This Property
The Home Valuation Report is an in-depth analysis detailing your home's value as well as a comparison with similar homes in the area
Home Values in the Area
Average Home Value in this Area
Purchase History
| Date | Buyer | Sale Price | Title Company |
|---|---|---|---|
| Spyridridopul Konstantina | $410,000 | -- | |
| Ooyle David A | $207,000 | -- |
Source: Public Records
Mortgage History
| Date | Status | Borrower | Loan Amount |
|---|---|---|---|
| Open | Spyridridopul Konstantina | $300,000 | |
| Previous Owner | Ooyle David A | $152,000 | |
| Previous Owner | Ooyle David A | $177,000 |
Source: Public Records
Tax History Compared to Growth
Tax History
| Year | Tax Paid | Tax Assessment Tax Assessment Total Assessment is a certain percentage of the fair market value that is determined by local assessors to be the total taxable value of land and additions on the property. | Land | Improvement |
|---|---|---|---|---|
| 2025 | $6,206 | $716,600 | $426,000 | $290,600 |
| 2024 | $5,975 | $668,400 | $403,900 | $264,500 |
| 2023 | $5,731 | $609,700 | $350,900 | $258,800 |
| 2022 | $5,617 | $564,500 | $319,900 | $244,600 |
| 2021 | $5,328 | $535,500 | $290,900 | $244,600 |
| 2020 | $5,162 | $535,500 | $290,900 | $244,600 |
| 2019 | $5,024 | $479,400 | $271,900 | $207,500 |
| 2018 | $4,696 | $442,200 | $258,900 | $183,300 |
| 2017 | $4,600 | $442,200 | $258,900 | $183,300 |
| 2016 | $4,563 | $398,200 | $220,900 | $177,300 |
| 2015 | $4,520 | $398,200 | $220,900 | $177,300 |
| 2014 | $4,360 | $363,300 | $200,900 | $162,400 |
Source: Public Records
Map
Nearby Homes