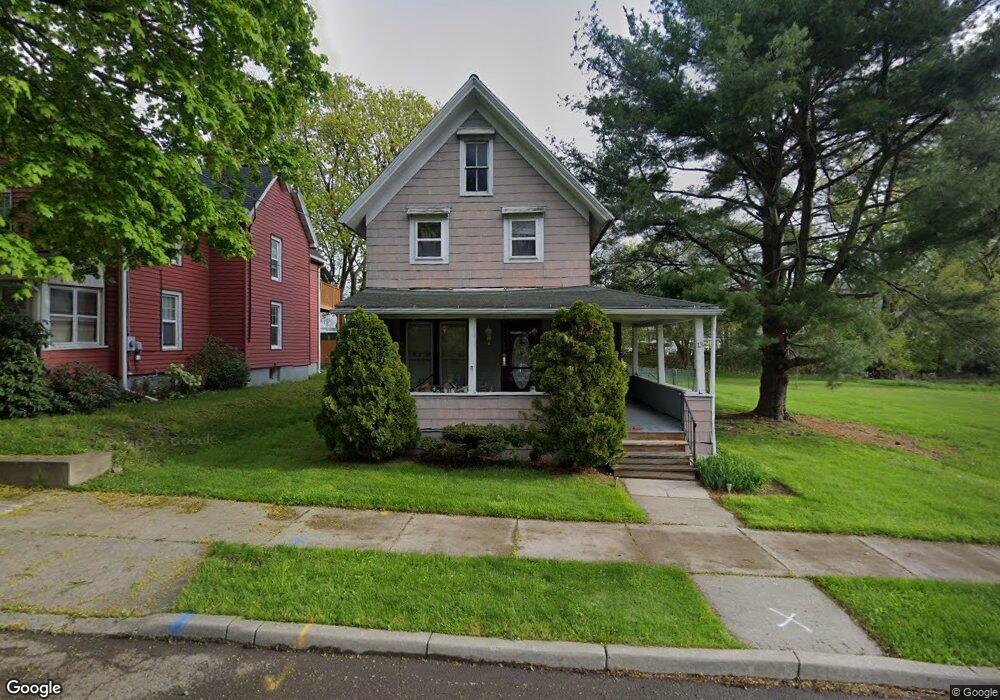
13 George St Binghamton, NY 13904
Eastside Binghamton NeighborhoodEstimated Value: $103,000 - $148,000
2
Beds
2
Baths
1,271
Sq Ft
$101/Sq Ft
Est. Value
About This Home
This home is located at 13 George St, Binghamton, NY 13904 and is currently estimated at $128,152, approximately $100 per square foot. 13 George St is a home located in Broome County with nearby schools including Calvin Coolidge Elementary School, Binghamton High School, and East Middle School.
Ownership History
Date
Name
Owned For
Owner Type
Purchase Details
Closed on
Oct 5, 2010
Sold by
Taubar Donnariis
Bought by
Johnson Christopher A
Current Estimated Value
Home Financials for this Owner
Home Financials are based on the most recent Mortgage that was taken out on this home.
Original Mortgage
$60,062
Outstanding Balance
$39,675
Interest Rate
4.37%
Mortgage Type
FHA
Estimated Equity
$88,477
Purchase Details
Closed on
Mar 26, 2004
Sold by
Brunelli Anthony
Bought by
Taubar Donnariis
Purchase Details
Closed on
Aug 28, 1996
Create a Home Valuation Report for This Property
The Home Valuation Report is an in-depth analysis detailing your home's value as well as a comparison with similar homes in the area
Home Values in the Area
Average Home Value in this Area
Purchase History
| Date | Buyer | Sale Price | Title Company |
|---|---|---|---|
| Johnson Christopher A | $61,170 | None Available | |
| Taubar Donnariis | $55,600 | Dwight Ball | |
| -- | -- | -- |
Source: Public Records
Mortgage History
| Date | Status | Borrower | Loan Amount |
|---|---|---|---|
| Open | Johnson Christopher A | $60,062 |
Source: Public Records
Tax History Compared to Growth
Tax History
| Year | Tax Paid | Tax Assessment Tax Assessment Total Assessment is a certain percentage of the fair market value that is determined by local assessors to be the total taxable value of land and additions on the property. | Land | Improvement |
|---|---|---|---|---|
| 2024 | $4,632 | $47,000 | $11,200 | $35,800 |
| 2023 | $4,548 | $47,000 | $11,200 | $35,800 |
| 2022 | $4,441 | $47,000 | $11,200 | $35,800 |
| 2021 | $4,391 | $47,000 | $11,200 | $35,800 |
| 2020 | $2,233 | $47,000 | $11,200 | $35,800 |
| 2019 | $1,482 | $47,000 | $11,200 | $35,800 |
| 2018 | $2,160 | $47,000 | $11,200 | $35,800 |
| 2017 | $2,188 | $47,000 | $11,200 | $35,800 |
| 2016 | $2,212 | $47,000 | $11,200 | $35,800 |
| 2015 | $2,538 | $47,000 | $11,200 | $35,800 |
| 2014 | $2,538 | $47,000 | $11,200 | $35,800 |
Source: Public Records
Map
Nearby Homes