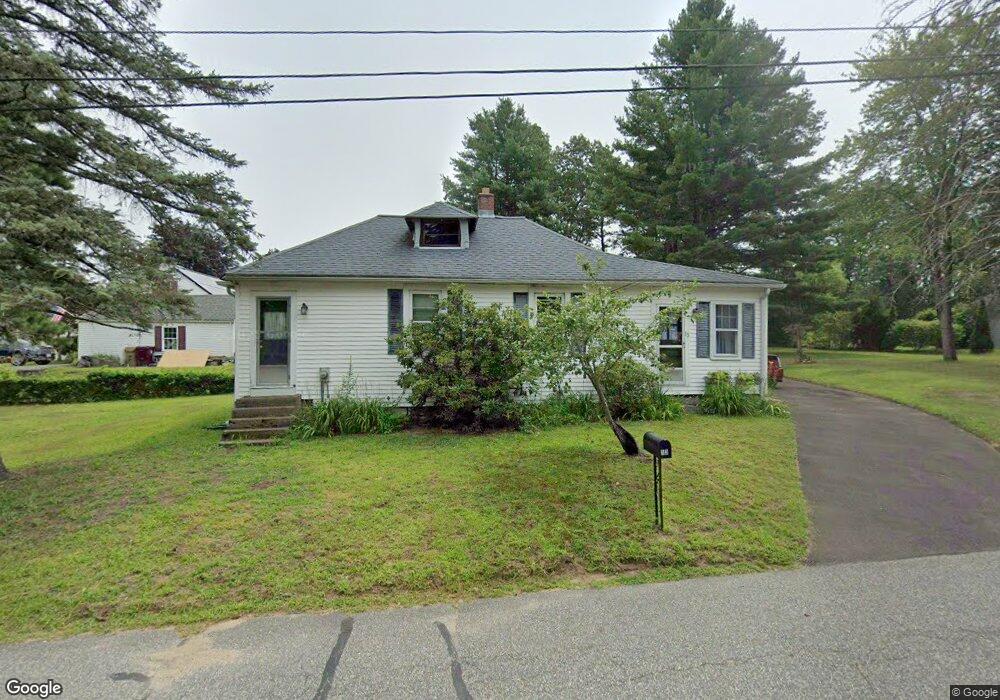
13 Glenwood St Ludlow, MA 01056
Estimated Value: $246,000 - $292,000
2
Beds
1
Bath
1,124
Sq Ft
$242/Sq Ft
Est. Value
About This Home
This home is located at 13 Glenwood St, Ludlow, MA 01056 and is currently estimated at $272,472, approximately $242 per square foot. 13 Glenwood St is a home located in Hampden County with nearby schools including East Street Elementary School, Chapin Street Elementary School, and Paul R. Baird Middle School.
Ownership History
Date
Name
Owned For
Owner Type
Purchase Details
Closed on
Aug 20, 2009
Sold by
Tierney Phillip A and Boduch-Tierney Angela
Bought by
Barton Julianne
Current Estimated Value
Home Financials for this Owner
Home Financials are based on the most recent Mortgage that was taken out on this home.
Original Mortgage
$115,193
Outstanding Balance
$74,722
Interest Rate
5.19%
Mortgage Type
Purchase Money Mortgage
Estimated Equity
$197,750
Purchase Details
Closed on
Sep 17, 2004
Sold by
Department Of Housing & Urban Dev
Bought by
Reyes Manuel T
Create a Home Valuation Report for This Property
The Home Valuation Report is an in-depth analysis detailing your home's value as well as a comparison with similar homes in the area
Home Values in the Area
Average Home Value in this Area
Purchase History
| Date | Buyer | Sale Price | Title Company |
|---|---|---|---|
| Barton Julianne | $117,500 | -- | |
| Barton Julianne | $117,500 | -- | |
| Reyes Manuel T | $79,300 | -- | |
| Reyes Manuel T | $79,300 | -- |
Source: Public Records
Mortgage History
| Date | Status | Borrower | Loan Amount |
|---|---|---|---|
| Open | Barton Julianne | $115,193 | |
| Closed | Reyes Manuel T | $115,193 |
Source: Public Records
Tax History Compared to Growth
Tax History
| Year | Tax Paid | Tax Assessment Tax Assessment Total Assessment is a certain percentage of the fair market value that is determined by local assessors to be the total taxable value of land and additions on the property. | Land | Improvement |
|---|---|---|---|---|
| 2025 | $3,817 | $220,000 | $82,700 | $137,300 |
| 2024 | $3,721 | $205,700 | $84,200 | $121,500 |
| 2023 | $3,469 | $177,800 | $73,900 | $103,900 |
| 2022 | $3,330 | $166,600 | $73,900 | $92,700 |
| 2021 | $3,362 | $159,500 | $73,900 | $85,600 |
| 2020 | $3,223 | $156,300 | $72,700 | $83,600 |
| 2019 | $2,977 | $150,200 | $72,000 | $78,200 |
| 2018 | $2,798 | $147,200 | $72,000 | $75,200 |
| 2017 | $2,700 | $145,700 | $69,900 | $75,800 |
| 2016 | $2,544 | $140,300 | $68,500 | $71,800 |
| 2015 | $2,389 | $138,200 | $67,800 | $70,400 |
Source: Public Records
Map
Nearby Homes