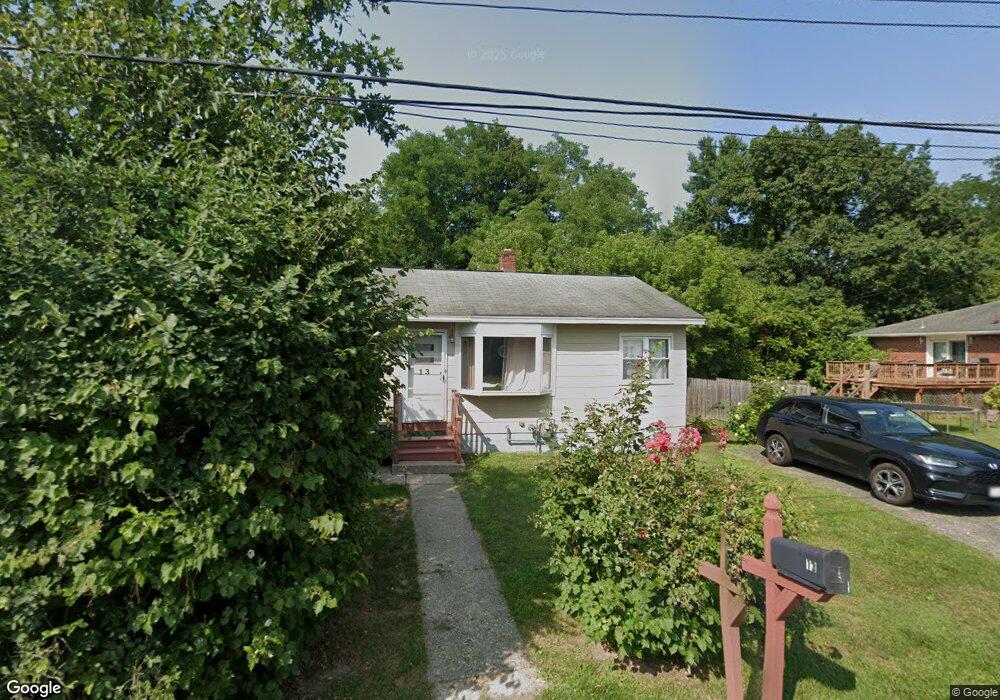
13 Golder St Albany, NY 12209
Normanskill NeighborhoodEstimated Value: $121,000 - $226,000
2
Beds
1
Bath
700
Sq Ft
$264/Sq Ft
Est. Value
About This Home
This home is located at 13 Golder St, Albany, NY 12209 and is currently estimated at $184,776, approximately $263 per square foot. 13 Golder St is a home located in Albany County with nearby schools including New Scotland Elementary School, William S Hackett Middle School, and Albany High School.
Ownership History
Date
Name
Owned For
Owner Type
Purchase Details
Closed on
Apr 11, 2012
Sold by
Barkman Lorraine M
Bought by
Leyden Kathryn H
Current Estimated Value
Home Financials for this Owner
Home Financials are based on the most recent Mortgage that was taken out on this home.
Original Mortgage
$63,000
Interest Rate
4.25%
Mortgage Type
New Conventional
Purchase Details
Closed on
Mar 1, 1996
Sold by
Livins Valdis
Bought by
Barkman Lorraine
Create a Home Valuation Report for This Property
The Home Valuation Report is an in-depth analysis detailing your home's value as well as a comparison with similar homes in the area
Home Values in the Area
Average Home Value in this Area
Purchase History
| Date | Buyer | Sale Price | Title Company |
|---|---|---|---|
| Leyden Kathryn H | $70,000 | None Available | |
| Barkman Lorraine | $58,500 | -- |
Source: Public Records
Mortgage History
| Date | Status | Borrower | Loan Amount |
|---|---|---|---|
| Closed | Leyden Kathryn H | $63,000 |
Source: Public Records
Tax History Compared to Growth
Tax History
| Year | Tax Paid | Tax Assessment Tax Assessment Total Assessment is a certain percentage of the fair market value that is determined by local assessors to be the total taxable value of land and additions on the property. | Land | Improvement |
|---|---|---|---|---|
| 2024 | $3,098 | $107,000 | $21,400 | $85,600 |
| 2023 | $2,771 | $68,000 | $14,000 | $54,000 |
| 2022 | $2,711 | $68,000 | $14,000 | $54,000 |
| 2021 | $2,705 | $68,000 | $14,000 | $54,000 |
| 2020 | $2,854 | $68,000 | $14,000 | $54,000 |
| 2019 | $2,677 | $68,000 | $14,000 | $54,000 |
| 2018 | $3,214 | $68,000 | $14,000 | $54,000 |
| 2017 | $1,224 | $68,000 | $14,000 | $54,000 |
| 2016 | $2,745 | $68,000 | $14,000 | $54,000 |
| 2015 | $2,805 | $70,000 | $17,200 | $52,800 |
| 2014 | -- | $70,000 | $17,200 | $52,800 |
Source: Public Records
Map
Nearby Homes