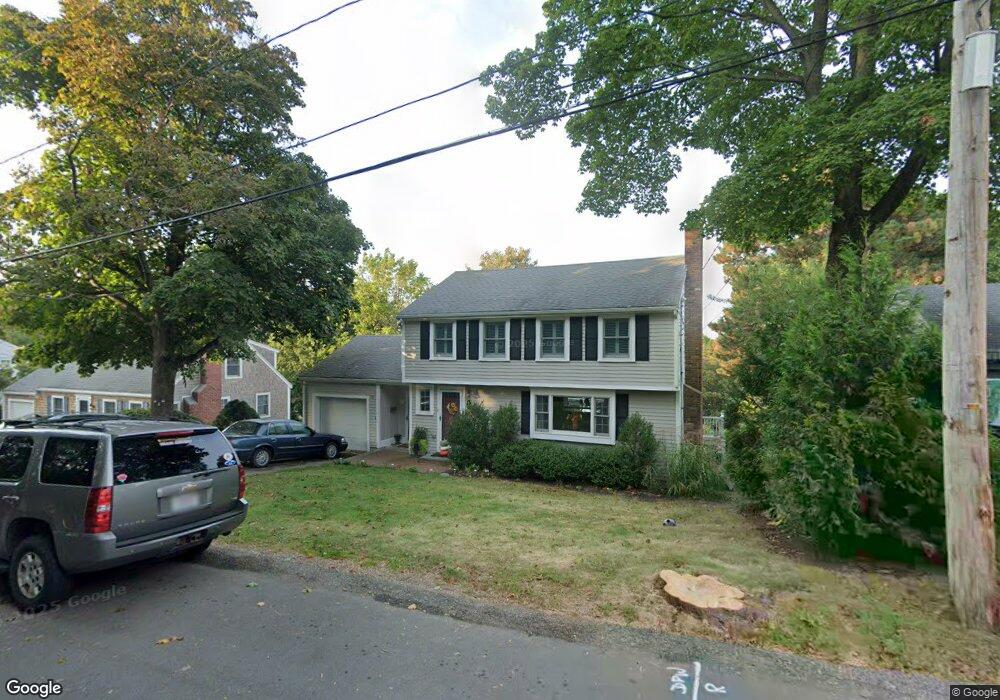
13 Governor Andrew Rd Hingham, MA 02043
Crow Point NeighborhoodEstimated Value: $986,000 - $1,171,000
4
Beds
2
Baths
1,773
Sq Ft
$628/Sq Ft
Est. Value
About This Home
This home is located at 13 Governor Andrew Rd, Hingham, MA 02043 and is currently estimated at $1,112,798, approximately $627 per square foot. 13 Governor Andrew Rd is a home located in Plymouth County with nearby schools including William L. Foster Elementary School, Derby Academy, and St. Paul Elementary School.
Ownership History
Date
Name
Owned For
Owner Type
Purchase Details
Closed on
Dec 30, 2020
Sold by
Flanders Paul C and Flanders Janet E
Bought by
P J Flanders Ft
Current Estimated Value
Purchase Details
Closed on
Nov 3, 2011
Sold by
Flanders Ft and Flanders Paul C
Bought by
Flanders Paul C
Home Financials for this Owner
Home Financials are based on the most recent Mortgage that was taken out on this home.
Original Mortgage
$293,000
Interest Rate
4.08%
Mortgage Type
Stand Alone Second
Purchase Details
Closed on
Mar 29, 2011
Sold by
Flanders Paul C and Flanders Jeanet E
Bought by
Flanders 2011 Ft and Flanders Paul C
Purchase Details
Closed on
Oct 7, 1995
Sold by
Anderson Charles R and Anderson Mary C
Bought by
Flanders Paul C and Flanders Janet E
Purchase Details
Closed on
Sep 29, 1988
Sold by
Bullotta Ronald M
Bought by
Anderson Charles R
Purchase Details
Closed on
Apr 3, 1987
Sold by
Sartucci August P
Bought by
Bullotta Ronald M
Create a Home Valuation Report for This Property
The Home Valuation Report is an in-depth analysis detailing your home's value as well as a comparison with similar homes in the area
Home Values in the Area
Average Home Value in this Area
Purchase History
| Date | Buyer | Sale Price | Title Company |
|---|---|---|---|
| P J Flanders Ft | -- | None Available | |
| Flanders Paul C | -- | -- | |
| Flanders 2011 Ft | -- | -- | |
| Flanders Paul C | $175,000 | -- | |
| Anderson Charles R | $255,000 | -- | |
| Bullotta Ronald M | $250,000 | -- |
Source: Public Records
Mortgage History
| Date | Status | Borrower | Loan Amount |
|---|---|---|---|
| Previous Owner | Flanders Paul C | $293,000 | |
| Previous Owner | Bullotta Ronald M | $300,000 | |
| Previous Owner | Bullotta Ronald M | $270,000 |
Source: Public Records
Tax History Compared to Growth
Tax History
| Year | Tax Paid | Tax Assessment Tax Assessment Total Assessment is a certain percentage of the fair market value that is determined by local assessors to be the total taxable value of land and additions on the property. | Land | Improvement |
|---|---|---|---|---|
| 2025 | $11,094 | $1,037,800 | $530,000 | $507,800 |
| 2024 | $10,783 | $993,800 | $530,000 | $463,800 |
| 2023 | $9,522 | $952,200 | $530,000 | $422,200 |
| 2022 | $8,743 | $756,300 | $441,700 | $314,600 |
| 2021 | $8,603 | $729,100 | $441,700 | $287,400 |
| 2020 | $8,407 | $729,100 | $441,700 | $287,400 |
| 2019 | $8,397 | $711,000 | $441,700 | $269,300 |
| 2018 | $8,368 | $711,000 | $441,700 | $269,300 |
| 2017 | $7,900 | $644,900 | $414,300 | $230,600 |
| 2016 | $7,809 | $625,200 | $394,600 | $230,600 |
| 2015 | $7,598 | $606,400 | $375,800 | $230,600 |
Source: Public Records
Map
Nearby Homes
- 6 Whiton Ave
- 12 Daley Rd
- 34 Otis Hill Rd
- 17 Paige St
- 53 Bel Air Rd - To Be Built
- 53 Bel Air Rd
- 16 Foley Beach Rd
- 15 Bayberry Rd
- 81 Kimball Beach Rd
- 125 Halsted Dr Unit 125
- 13 Ship St
- 246 North St
- 191 South St
- 21 Hersey St
- 102 Central St
- 10R Martins Ln
- 130 Broad Reach Unit 506
- 130 Broad Reach Unit 206
- 504 Tuckers Ln
- 10 Shipyard Dr Unit 313
- 15 Governor Andrew Rd
- 9 Governor Andrew Rd
- 216 Otis St
- 17 Governor Andrew Rd
- 212 Otis St
- 31 Governor Long Rd
- 22 Governor Andrew Rd
- 29 Governor Long Rd
- 222 Otis St
- 21 Governor Andrew Rd
- 7 Governor Andrew Rd
- 24 Governor Andrew Rd
- 27 Governor Long Rd
- 39 Governor Long Rd
- 204 Otis St
- 23 Governor Andrew Rd
- 26 Governor Andrew Rd
- 3 Governor Andrew Rd
- 43 Governor Long Rd
- 217 Otis St