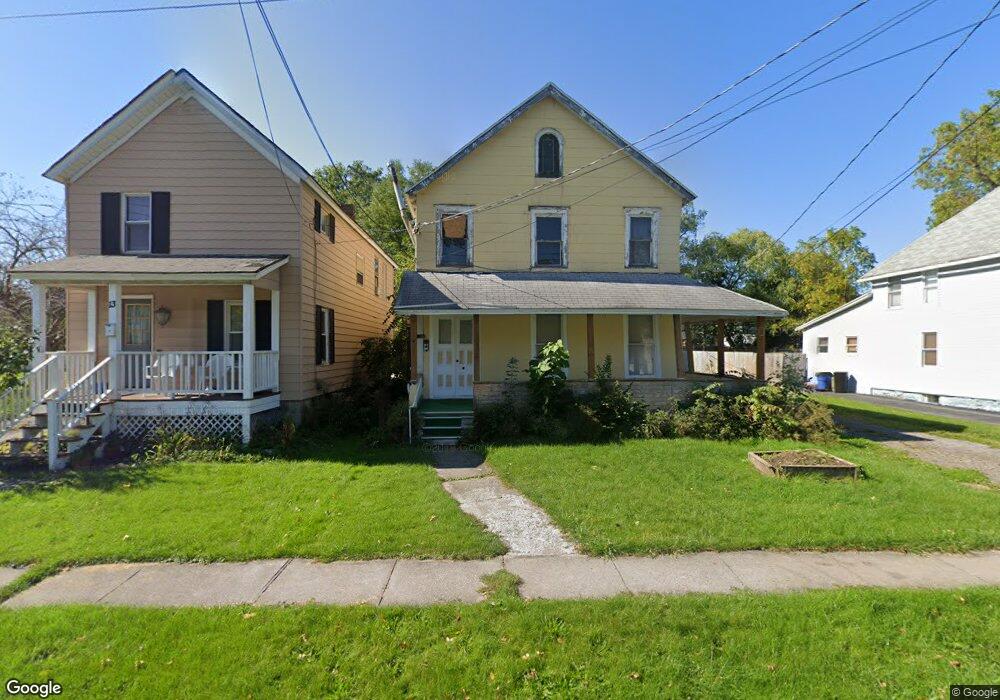
13 Grove Ave Auburn, NY 13021
Estimated Value: $122,724 - $131,000
3
Beds
1
Bath
1,216
Sq Ft
$105/Sq Ft
Est. Value
About This Home
This home is located at 13 Grove Ave, Auburn, NY 13021 and is currently estimated at $127,181, approximately $104 per square foot. 13 Grove Ave is a home located in Cayuga County with nearby schools including Auburn Junior High School, Auburn High School, and St Joseph School.
Ownership History
Date
Name
Owned For
Owner Type
Purchase Details
Closed on
Sep 17, 2021
Sold by
Doyle Clifford A
Bought by
Doyle Tyler J
Current Estimated Value
Purchase Details
Closed on
Jun 25, 2015
Sold by
Tardibone Steven D
Bought by
Doyle Clifford A
Home Financials for this Owner
Home Financials are based on the most recent Mortgage that was taken out on this home.
Original Mortgage
$39,000
Interest Rate
10%
Mortgage Type
Seller Take Back
Purchase Details
Closed on
Oct 25, 2006
Sold by
Shepardson Helen
Bought by
Tardibone Steven
Purchase Details
Closed on
Jul 7, 2006
Sold by
Shepardson Helen
Bought by
Lasalle Bank National Associat
Purchase Details
Closed on
Jun 27, 2006
Sold by
Shepardson Helen
Bought by
Lasalle Bank National Associat
Purchase Details
Closed on
Jan 27, 2005
Sold by
Shepardson Thomas
Bought by
Shepardson Helen
Purchase Details
Closed on
Apr 17, 1997
Create a Home Valuation Report for This Property
The Home Valuation Report is an in-depth analysis detailing your home's value as well as a comparison with similar homes in the area
Home Values in the Area
Average Home Value in this Area
Purchase History
| Date | Buyer | Sale Price | Title Company |
|---|---|---|---|
| Doyle Tyler J | $34,000 | None Available | |
| Doyle Clifford A | $40,000 | David Thurston | |
| Doyle Clifford A | $40,000 | None Available | |
| Tardibone Steven | $23,900 | Geo Iocalano | |
| Lasalle Bank National Associat | $500 | Steven Baum | |
| Lasalle Bank National Associat | $500 | Steven Baum | |
| Shepardson Helen | -- | Erin Champion | |
| -- | -- | -- |
Source: Public Records
Mortgage History
| Date | Status | Borrower | Loan Amount |
|---|---|---|---|
| Previous Owner | Doyle Clifford A | $39,000 |
Source: Public Records
Tax History Compared to Growth
Tax History
| Year | Tax Paid | Tax Assessment Tax Assessment Total Assessment is a certain percentage of the fair market value that is determined by local assessors to be the total taxable value of land and additions on the property. | Land | Improvement |
|---|---|---|---|---|
| 2024 | $1,823 | $78,200 | $10,400 | $67,800 |
| 2023 | $1,821 | $78,200 | $10,400 | $67,800 |
| 2022 | $1,801 | $78,200 | $10,400 | $67,800 |
| 2021 | $1,551 | $56,600 | $9,000 | $47,600 |
| 2020 | $1,532 | $56,600 | $9,000 | $47,600 |
| 2019 | $481 | $56,600 | $9,000 | $47,600 |
| 2018 | $1,521 | $56,600 | $9,000 | $47,600 |
| 2017 | $1,576 | $57,600 | $9,400 | $48,200 |
| 2016 | $1,884 | $57,600 | $9,400 | $48,200 |
| 2015 | $788 | $57,600 | $9,400 | $48,200 |
| 2014 | $788 | $57,600 | $9,400 | $48,200 |
Source: Public Records
Map
Nearby Homes