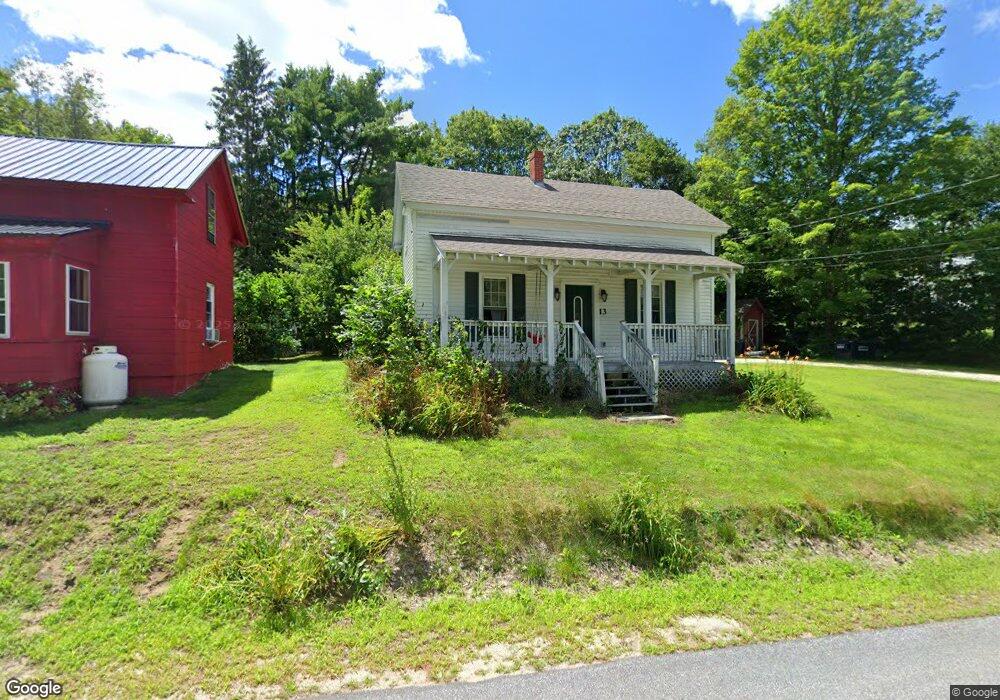
13 Grove St Mechanic Falls, ME 04256
Estimated Value: $271,000 - $326,000
4
Beds
2
Baths
1,617
Sq Ft
$188/Sq Ft
Est. Value
About This Home
This home is located at 13 Grove St, Mechanic Falls, ME 04256 and is currently estimated at $303,412, approximately $187 per square foot. 13 Grove St is a home located in Androscoggin County with nearby schools including Elm Street School - Mechanic Falls and Poland Spring Academy.
Ownership History
Date
Name
Owned For
Owner Type
Purchase Details
Closed on
Aug 3, 2012
Sold by
Klinger Kevin
Bought by
Hunter Stephen and Mcmanus Alicia
Current Estimated Value
Home Financials for this Owner
Home Financials are based on the most recent Mortgage that was taken out on this home.
Original Mortgage
$142,857
Outstanding Balance
$99,104
Interest Rate
3.7%
Mortgage Type
New Conventional
Estimated Equity
$204,308
Purchase Details
Closed on
Jun 3, 2008
Sold by
Decoster Jeremy J and Decoster Fhlmc
Bought by
Fhlmc
Create a Home Valuation Report for This Property
The Home Valuation Report is an in-depth analysis detailing your home's value as well as a comparison with similar homes in the area
Home Values in the Area
Average Home Value in this Area
Purchase History
| Date | Buyer | Sale Price | Title Company |
|---|---|---|---|
| Hunter Stephen | -- | -- | |
| Fhlmc | -- | -- | |
| Hunter Stephen | -- | -- | |
| Fhlmc | -- | -- |
Source: Public Records
Mortgage History
| Date | Status | Borrower | Loan Amount |
|---|---|---|---|
| Open | Hunter Stephen | $142,857 | |
| Closed | Fhlmc | $142,857 | |
| Previous Owner | Fhlmc | $71,400 |
Source: Public Records
Tax History Compared to Growth
Tax History
| Year | Tax Paid | Tax Assessment Tax Assessment Total Assessment is a certain percentage of the fair market value that is determined by local assessors to be the total taxable value of land and additions on the property. | Land | Improvement |
|---|---|---|---|---|
| 2024 | $2,878 | $186,854 | $45,230 | $141,624 |
| 2023 | $2,616 | $186,854 | $45,230 | $141,624 |
| 2022 | $2,529 | $113,647 | $22,271 | $91,376 |
| 2021 | $2,455 | $113,647 | $22,271 | $91,376 |
| 2020 | $2,438 | $113,647 | $22,271 | $91,376 |
| 2019 | $2,381 | $113,647 | $22,271 | $91,376 |
| 2018 | $2,478 | $113,647 | $22,271 | $91,376 |
| 2017 | $2,500 | $113,647 | $22,271 | $91,376 |
| 2016 | $2,423 | $113,647 | $22,271 | $91,376 |
| 2015 | $2,432 | $113,647 | $22,271 | $91,376 |
| 2014 | $2,409 | $113,647 | $22,271 | $91,376 |
Source: Public Records
Map
Nearby Homes
- 90 Elm St
- 91 Elm St
- 63 Elm St
- 91 Lewiston St
- 30 Highland Ave
- 125 S Main St
- 24 Clifford St
- 107 Riverside Dr
- 33 Dunlop Ave
- 30 North St
- 19 Tirrell Ave
- 62 North St
- 71 Jordan Rd
- R03-007-A Pottle Hill Rd
- 78 Star Dr
- 389 Pleasant St
- 450 Millett Rd
- Lot 14C Mechanic Falls Rd
- 42 Olde Birch Ln
- 125 Pigeon Hill Rd