Estimated Value: $152,000 - $173,491
2
Beds
2
Baths
1,176
Sq Ft
$140/Sq Ft
Est. Value
About This Home
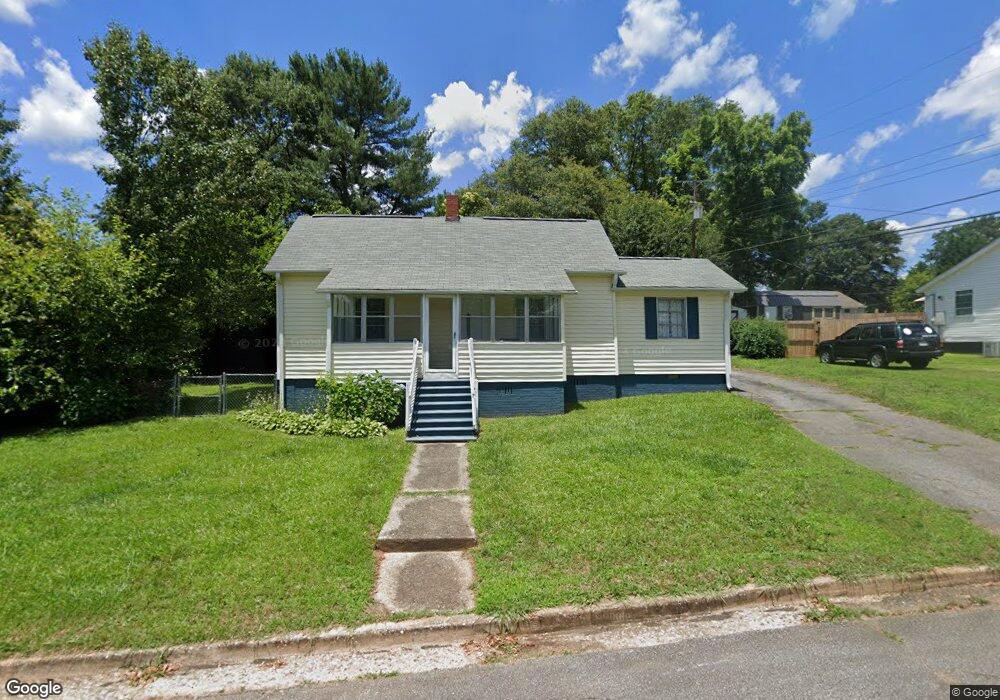
This home is located at 13 H St, Inman, SC 29349 and is currently estimated at $164,373, approximately $139 per square foot. 13 H St is a home located in Spartanburg County with nearby schools including Inman Elementary School, T.E. Mabry Middle School, and Chapman High School.
Ownership History
Date
Name
Owned For
Owner Type
Purchase Details
Closed on
Nov 6, 2020
Sold by
Owens Julie and Wong Rebecca
Bought by
Serig Susan Marie
Current Estimated Value
Home Financials for this Owner
Home Financials are based on the most recent Mortgage that was taken out on this home.
Original Mortgage
$114,000
Outstanding Balance
$101,444
Interest Rate
2.8%
Mortgage Type
New Conventional
Estimated Equity
$62,929
Purchase Details
Closed on
Sep 23, 2010
Sold by
Fannie Mae
Bought by
Owens Julie and Wong Rebecca
Purchase Details
Closed on
Jul 8, 2010
Sold by
Nodine Tara E
Bought by
Federal National Mortgage Association
Purchase Details
Closed on
May 31, 2001
Sold by
Cleveland Annie B
Bought by
Nodine Tara E
Create a Home Valuation Report for This Property
The Home Valuation Report is an in-depth analysis detailing your home's value as well as a comparison with similar homes in the area
Home Values in the Area
Average Home Value in this Area
Purchase History
| Date | Buyer | Sale Price | Title Company |
|---|---|---|---|
| Serig Susan Marie | $120,000 | None Available | |
| Owens Julie | $32,500 | -- | |
| Federal National Mortgage Association | $2,500 | -- | |
| Nodine Tara E | $79,900 | -- |
Source: Public Records
Mortgage History
| Date | Status | Borrower | Loan Amount |
|---|---|---|---|
| Open | Serig Susan Marie | $114,000 |
Source: Public Records
Tax History
| Year | Tax Paid | Tax Assessment Tax Assessment Total Assessment is a certain percentage of the fair market value that is determined by local assessors to be the total taxable value of land and additions on the property. | Land | Improvement |
|---|---|---|---|---|
| 2025 | $1,025 | $5,520 | $692 | $4,828 |
| 2024 | $1,025 | $5,520 | $692 | $4,828 |
| 2023 | $1,025 | $5,520 | $692 | $4,828 |
Source: Public Records
Map
Nearby Homes
Your Personal Tour Guide
Ask me questions while you tour the home.