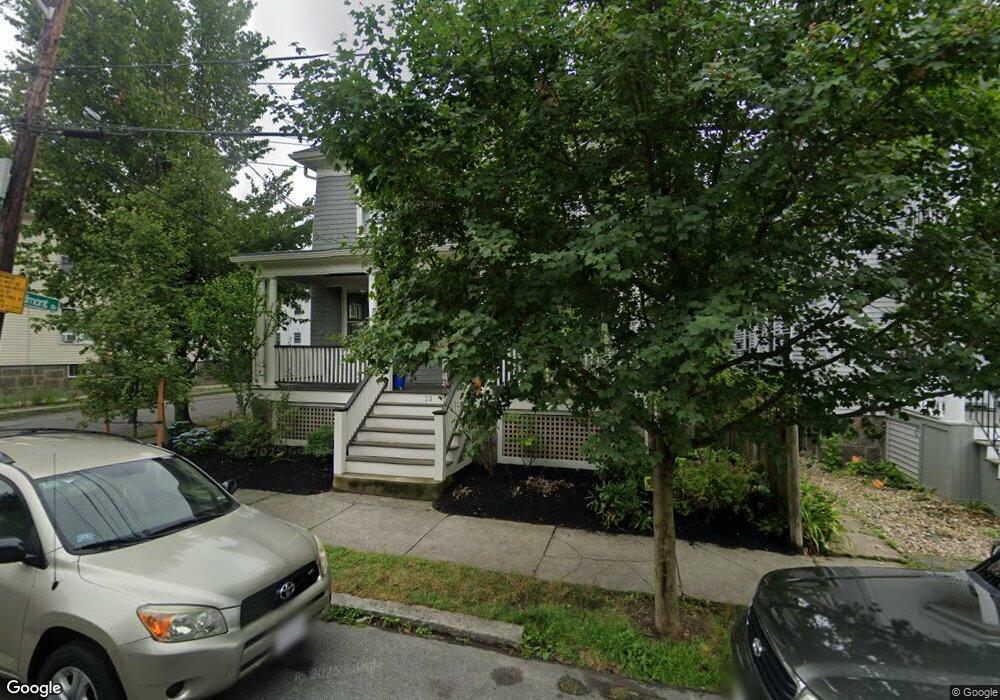
13 Hancock St Salem, MA 01970
South Salem NeighborhoodEstimated Value: $589,000 - $815,000
3
Beds
2
Baths
1,958
Sq Ft
$343/Sq Ft
Est. Value
About This Home
This home is located at 13 Hancock St, Salem, MA 01970 and is currently estimated at $670,931, approximately $342 per square foot. 13 Hancock St is a home located in Essex County with nearby schools including Saltonstall School, Carlton Elementary School, and Bates Elementary School.
Ownership History
Date
Name
Owned For
Owner Type
Purchase Details
Closed on
Mar 14, 2024
Sold by
Hayes John T and Pahlavan Dominique
Bought by
Hayes Gabrielle and Hayes Gianna
Current Estimated Value
Purchase Details
Closed on
Jun 1, 1994
Sold by
Johnson Lesley L
Bought by
Hayes John T and Pahlavan Dominique
Create a Home Valuation Report for This Property
The Home Valuation Report is an in-depth analysis detailing your home's value as well as a comparison with similar homes in the area
Home Values in the Area
Average Home Value in this Area
Purchase History
| Date | Buyer | Sale Price | Title Company |
|---|---|---|---|
| Hayes Gabrielle | -- | None Available | |
| Hayes John T | $131,000 | -- |
Source: Public Records
Mortgage History
| Date | Status | Borrower | Loan Amount |
|---|---|---|---|
| Previous Owner | Hayes John T | $180,000 | |
| Previous Owner | Hayes John T | $203,350 | |
| Previous Owner | Hayes John T | $50,000 |
Source: Public Records
Tax History
| Year | Tax Paid | Tax Assessment Tax Assessment Total Assessment is a certain percentage of the fair market value that is determined by local assessors to be the total taxable value of land and additions on the property. | Land | Improvement |
|---|---|---|---|---|
| 2025 | $5,764 | $508,300 | $162,000 | $346,300 |
| 2024 | $5,567 | $479,100 | $153,500 | $325,600 |
| 2023 | $5,341 | $426,900 | $142,100 | $284,800 |
| 2022 | $5,185 | $391,300 | $133,600 | $257,700 |
| 2021 | $5,238 | $379,600 | $133,600 | $246,000 |
| 2020 | $4,854 | $335,900 | $115,400 | $220,500 |
| 2019 | $4,830 | $319,900 | $109,700 | $210,200 |
| 2018 | $4,685 | $304,600 | $104,600 | $200,000 |
| 2017 | $4,406 | $277,800 | $85,300 | $192,500 |
| 2016 | $4,281 | $273,200 | $80,700 | $192,500 |
| 2015 | $4,173 | $254,300 | $72,800 | $181,500 |
Source: Public Records
Map
Nearby Homes
- 13 Roslyn St Unit 2
- 7 Fairfield St
- 6R Hazel Terrace Unit 1
- 10 Hazel St Unit 2
- 3 Chase St
- 185 Lafayette St Unit 3
- 59 Leach St Unit 2
- 4 Willow Ave Unit 2
- 88 Congress St Unit 3
- 9 Glover St Unit 1
- 22 Prescott St Unit 1
- 29 Ocean Ave Unit 4
- 1 Shore Ave
- 15 Phelps St Unit 1
- 24 Wisteria St Unit 2
- 326 Lafayette St Unit 2
- 259 Jefferson Ave
- 86 Wharf St Unit 6
- 263 Jefferson Ave
- 11 Summer St
- 15 Hancock St
- 8 Piedmont St
- 11 Hancock St Unit 1R
- 11 Hancock St
- 17 Hancock St
- 17 Hancock St Unit 3
- 10 Piedmont St
- 19 Hancock St
- 19 Hancock St Unit 2
- 19 Hancock St Unit 3
- 12 Hancock St
- 12 Hancock St Unit 1R
- 5 Piedmont St Unit 2
- 5 Piedmont St Unit 1
- 5 Piedmont St Unit ID1364233P
- 5 Piedmont St
- 14 Piedmont St
- 14 Hancock St
- 7 Hancock St Unit 1
- 7 Hancock St Unit 2
Your Personal Tour Guide
Ask me questions while you tour the home.