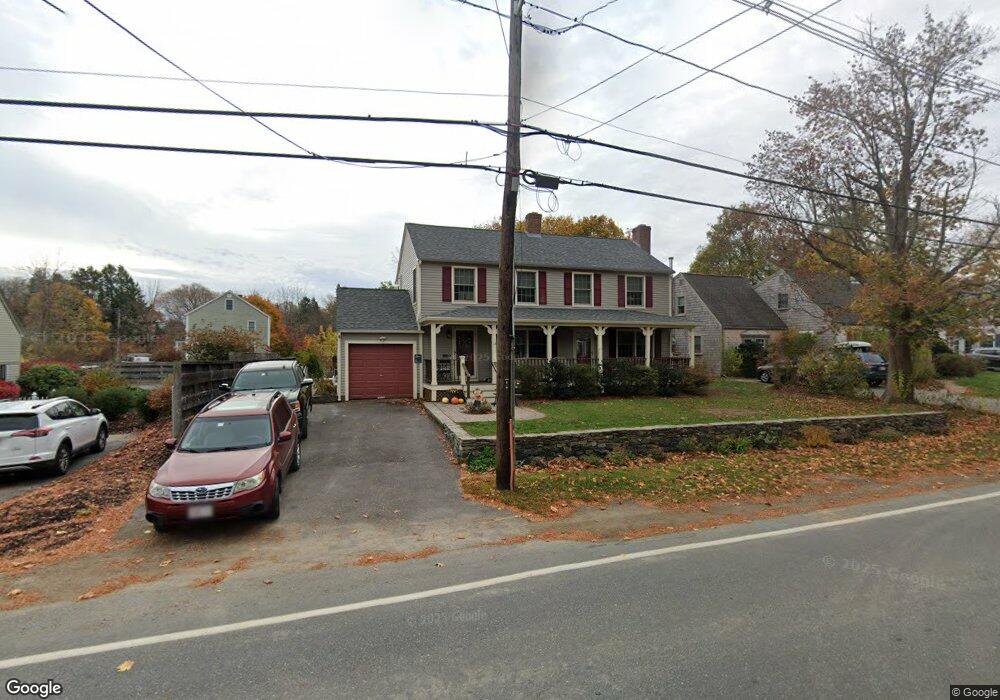
13 Hanover St Newbury, MA 01951
Estimated Value: $770,000 - $925,000
2
Beds
2
Baths
1,824
Sq Ft
$462/Sq Ft
Est. Value
About This Home
This home is located at 13 Hanover St, Newbury, MA 01951 and is currently estimated at $841,881, approximately $461 per square foot. 13 Hanover St is a home located in Essex County with nearby schools including Triton Regional High School, River Valley Charter School, and Immaculate Conception School.
Ownership History
Date
Name
Owned For
Owner Type
Purchase Details
Closed on
Jul 9, 2024
Sold by
Mcmahon Dale R
Bought by
Dale Robin S Mcmahon Ret and Mcmahon
Current Estimated Value
Purchase Details
Closed on
Apr 11, 1984
Bought by
Mcmahon Francis G and Mcmahon Dale R
Create a Home Valuation Report for This Property
The Home Valuation Report is an in-depth analysis detailing your home's value as well as a comparison with similar homes in the area
Home Values in the Area
Average Home Value in this Area
Purchase History
| Date | Buyer | Sale Price | Title Company |
|---|---|---|---|
| Dale Robin S Mcmahon Ret | -- | None Available | |
| Dale Robin S Mcmahon Ret | -- | None Available | |
| Dale Robin S Mcmahon Ret | -- | None Available | |
| Dale Robin S Mcmahon Ret | -- | None Available | |
| Mcmahon Francis G | $62,000 | -- |
Source: Public Records
Mortgage History
| Date | Status | Borrower | Loan Amount |
|---|---|---|---|
| Previous Owner | Mcmahon Francis G | $85,000 |
Source: Public Records
Tax History Compared to Growth
Tax History
| Year | Tax Paid | Tax Assessment Tax Assessment Total Assessment is a certain percentage of the fair market value that is determined by local assessors to be the total taxable value of land and additions on the property. | Land | Improvement |
|---|---|---|---|---|
| 2025 | $5,509 | $739,400 | $420,900 | $318,500 |
| 2024 | $5,285 | $688,200 | $385,800 | $302,400 |
| 2023 | $5,440 | $627,500 | $350,700 | $276,800 |
| 2022 | $5,432 | $558,300 | $315,600 | $242,700 |
| 2021 | $4,959 | $465,200 | $245,500 | $219,700 |
| 2020 | $5,019 | $456,700 | $245,500 | $211,200 |
| 2019 | $4,937 | $456,700 | $245,500 | $211,200 |
| 2018 | $4,562 | $418,500 | $220,900 | $197,600 |
| 2017 | $4,256 | $401,100 | $210,400 | $190,700 |
| 2016 | $4,396 | $385,600 | $210,400 | $175,200 |
| 2015 | $4,139 | $359,300 | $184,100 | $175,200 |
| 2014 | $3,909 | $345,300 | $170,100 | $175,200 |
Source: Public Records
Map
Nearby Homes
- 4 Hanover St
- 1 Littles Ln
- 1 Lancaster Rd
- 26 Beacon Ave
- 100 High Rd
- 113 Prospect St Unit B
- 33 Union St
- 105 High Rd Unit Lot 2
- 17 Madison St
- 4 Goodwin Ave
- 58 Lime St Unit 5
- 57 Lime St Unit 1
- 164 Water St Unit A
- 166 Water St Unit B
- 95 High St Unit 4
- 95 High St Unit 1
- 10 Beck St
- 11 Orange St Unit 2
- 42 Federal St Unit B
- 105 State St Unit 301