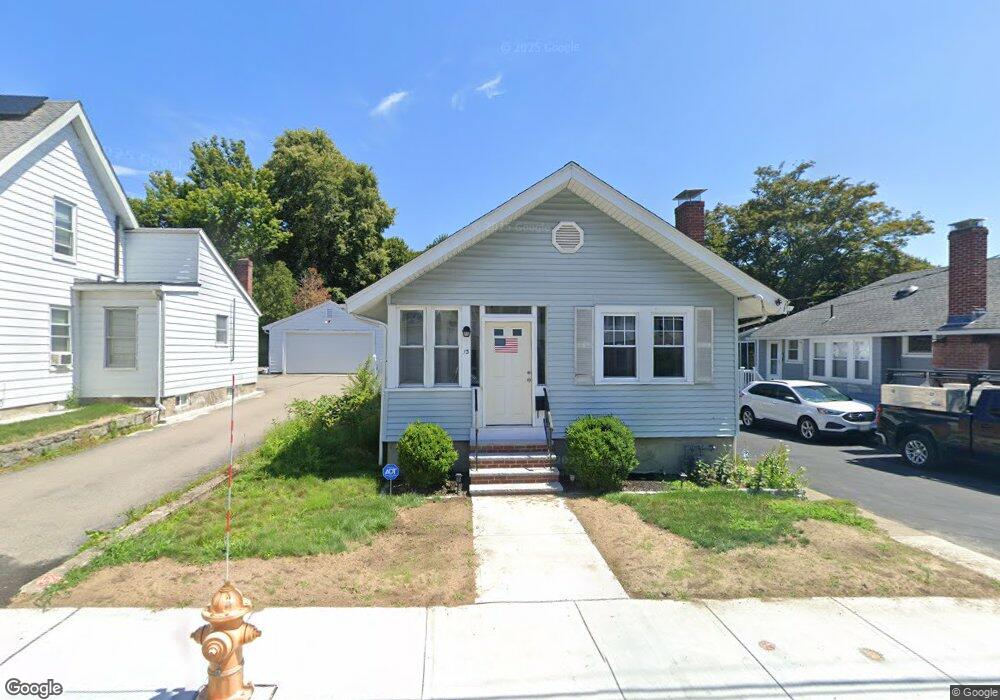
13 Harris St Quincy, MA 02169
South Quincy NeighborhoodEstimated Value: $506,000 - $572,000
2
Beds
1
Bath
828
Sq Ft
$655/Sq Ft
Est. Value
About This Home
This home is located at 13 Harris St, Quincy, MA 02169 and is currently estimated at $542,616, approximately $655 per square foot. 13 Harris St is a home located in Norfolk County with nearby schools including South West Middle School, Lincoln-Hancock Community School, and Quincy High School.
Ownership History
Date
Name
Owned For
Owner Type
Purchase Details
Closed on
Aug 22, 1997
Sold by
Richardi Anthony R and Richardi Dorothy C
Bought by
Kelley Patricia
Current Estimated Value
Purchase Details
Closed on
Mar 2, 1992
Sold by
Swett Gdn Carol A
Bought by
Richardi Anthony R and Richardi Dorothy C
Home Financials for this Owner
Home Financials are based on the most recent Mortgage that was taken out on this home.
Original Mortgage
$84,800
Interest Rate
8.38%
Mortgage Type
Purchase Money Mortgage
Create a Home Valuation Report for This Property
The Home Valuation Report is an in-depth analysis detailing your home's value as well as a comparison with similar homes in the area
Home Values in the Area
Average Home Value in this Area
Purchase History
| Date | Buyer | Sale Price | Title Company |
|---|---|---|---|
| Kelley Patricia | $130,000 | -- | |
| Richardi Anthony R | $106,000 | -- |
Source: Public Records
Mortgage History
| Date | Status | Borrower | Loan Amount |
|---|---|---|---|
| Previous Owner | Richardi Anthony R | $84,800 |
Source: Public Records
Tax History Compared to Growth
Tax History
| Year | Tax Paid | Tax Assessment Tax Assessment Total Assessment is a certain percentage of the fair market value that is determined by local assessors to be the total taxable value of land and additions on the property. | Land | Improvement |
|---|---|---|---|---|
| 2025 | $5,027 | $436,000 | $262,800 | $173,200 |
| 2024 | $4,709 | $417,800 | $250,300 | $167,500 |
| 2023 | $4,534 | $407,400 | $238,300 | $169,100 |
| 2022 | $4,150 | $346,400 | $190,700 | $155,700 |
| 2021 | $4,096 | $337,400 | $190,700 | $146,700 |
| 2020 | $3,912 | $314,700 | $190,700 | $124,000 |
| 2019 | $3,798 | $302,600 | $185,100 | $117,500 |
| 2018 | $3,730 | $279,600 | $171,400 | $108,200 |
| 2017 | $3,673 | $259,200 | $163,200 | $96,000 |
| 2016 | $3,459 | $240,900 | $148,400 | $92,500 |
| 2015 | $3,262 | $223,400 | $140,000 | $83,400 |
| 2014 | $3,183 | $214,200 | $140,000 | $74,200 |
Source: Public Records
Map
Nearby Homes
- 211 Copeland St
- 73 Connell St
- 1 Cityview Ln Unit 506
- 1 Cityview Ln Unit 210
- 1 Cityview Ln Unit 709
- 1 Cityview Ln Unit 204
- 46 Suomi Rd
- 46 Suomi Rd Unit 46
- 46-48 Buckley St
- 57 Buckley St
- 10 White St
- 25 Carrolls Ln
- 42 West St
- 14 Arthur Ave
- 510 Willard St
- 12 Arthur Ave
- 21 Arthur St
- 89 Puritan Dr
- 29 Oconnell Ave
- 91 Garfield St