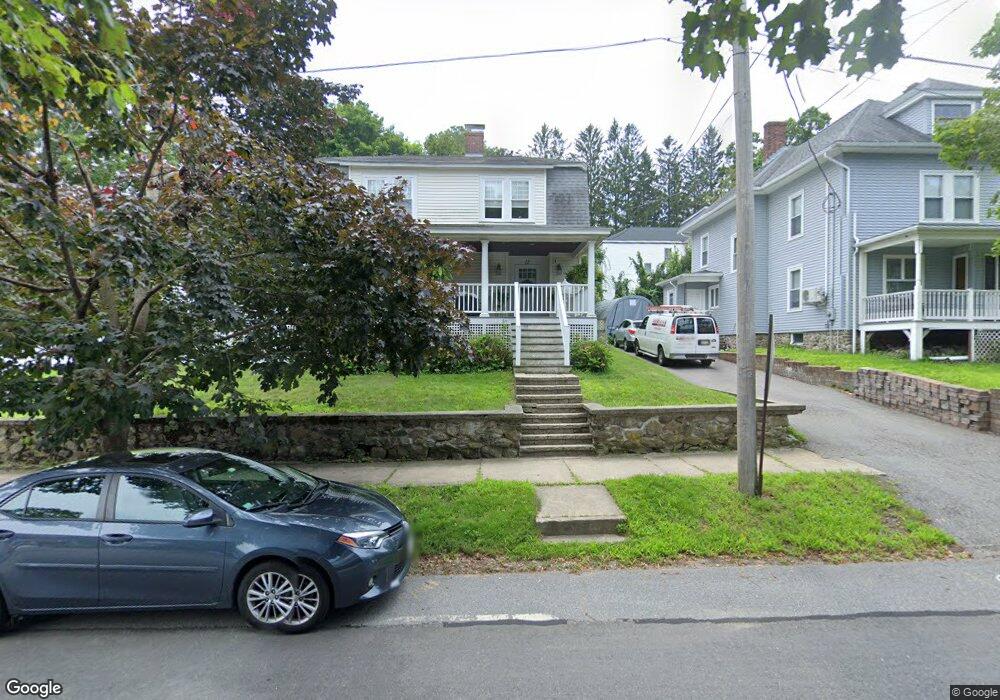
13 Haskell Ave Clinton, MA 01510
Estimated Value: $339,000 - $582,000
4
Beds
3
Baths
2,308
Sq Ft
$220/Sq Ft
Est. Value
About This Home
This home is located at 13 Haskell Ave, Clinton, MA 01510 and is currently estimated at $506,895, approximately $219 per square foot. 13 Haskell Ave is a home located in Worcester County with nearby schools including Clinton Elementary School, Clinton Senior High School, and Clinton Middle School.
Ownership History
Date
Name
Owned For
Owner Type
Purchase Details
Closed on
Aug 21, 2020
Sold by
Naughton Ellen R
Bought by
Murphy Ellen R
Current Estimated Value
Home Financials for this Owner
Home Financials are based on the most recent Mortgage that was taken out on this home.
Original Mortgage
$286,000
Outstanding Balance
$252,558
Interest Rate
3%
Mortgage Type
New Conventional
Estimated Equity
$254,337
Purchase Details
Closed on
Apr 12, 2017
Sold by
Naughton Harold P and Naughton Ellen
Bought by
Naughton Ellen
Purchase Details
Closed on
Aug 20, 1997
Sold by
Brower Daniel A and Brower Mary B
Bought by
Naughton Harold and Naughton Ellen
Home Financials for this Owner
Home Financials are based on the most recent Mortgage that was taken out on this home.
Original Mortgage
$130,150
Interest Rate
7.42%
Mortgage Type
Purchase Money Mortgage
Create a Home Valuation Report for This Property
The Home Valuation Report is an in-depth analysis detailing your home's value as well as a comparison with similar homes in the area
Home Values in the Area
Average Home Value in this Area
Purchase History
| Date | Buyer | Sale Price | Title Company |
|---|---|---|---|
| Murphy Ellen R | -- | None Available | |
| Naughton Ellen | -- | -- | |
| Naughton Harold | $137,000 | -- |
Source: Public Records
Mortgage History
| Date | Status | Borrower | Loan Amount |
|---|---|---|---|
| Open | Murphy Ellen R | $286,000 | |
| Previous Owner | Naughton Harold | $180,200 | |
| Previous Owner | Naughton Harold | $180,800 | |
| Previous Owner | Naughton Harold | $463,300 | |
| Previous Owner | Naughton Harold | $130,150 |
Source: Public Records
Tax History
| Year | Tax Paid | Tax Assessment Tax Assessment Total Assessment is a certain percentage of the fair market value that is determined by local assessors to be the total taxable value of land and additions on the property. | Land | Improvement |
|---|---|---|---|---|
| 2025 | $6,443 | $484,400 | $125,900 | $358,500 |
| 2024 | $6,400 | $487,100 | $125,900 | $361,200 |
| 2023 | $6,002 | $448,900 | $114,500 | $334,400 |
| 2022 | $5,973 | $400,600 | $104,100 | $296,500 |
| 2021 | $5,208 | $326,700 | $99,200 | $227,500 |
| 2020 | $5,057 | $326,500 | $99,200 | $227,300 |
| 2019 | $4,766 | $299,200 | $96,200 | $203,000 |
| 2018 | $4,912 | $289,300 | $92,400 | $196,900 |
| 2017 | $4,382 | $248,000 | $92,400 | $155,600 |
| 2016 | $4,463 | $258,400 | $92,400 | $166,000 |
| 2015 | $4,432 | $266,000 | $89,700 | $176,300 |
| 2014 | $4,296 | $266,000 | $89,700 | $176,300 |
Source: Public Records
Map
Nearby Homes
- 155 Cedar St
- 115117 Mechanic St Unit 4
- 115117 Mechanic St Unit 3
- 25 Pearl St
- 540 Main St Unit 303
- 57 Clark St
- 719 Main St
- 40 Nashua St Unit 3
- 55 Sterling St Unit 306
- 55 Sterling St Unit 312
- 55 Sterling St Unit 314
- 55 Sterling St Unit 212
- 101 Woodruff Rd
- 30 Richman St
- 508 High St
- 85 Beacon St
- 212 Chace St
- 5 Richman St
- 2 Eagle Nest Unit B6-2
- 109 Oak St
Your Personal Tour Guide
Ask me questions while you tour the home.