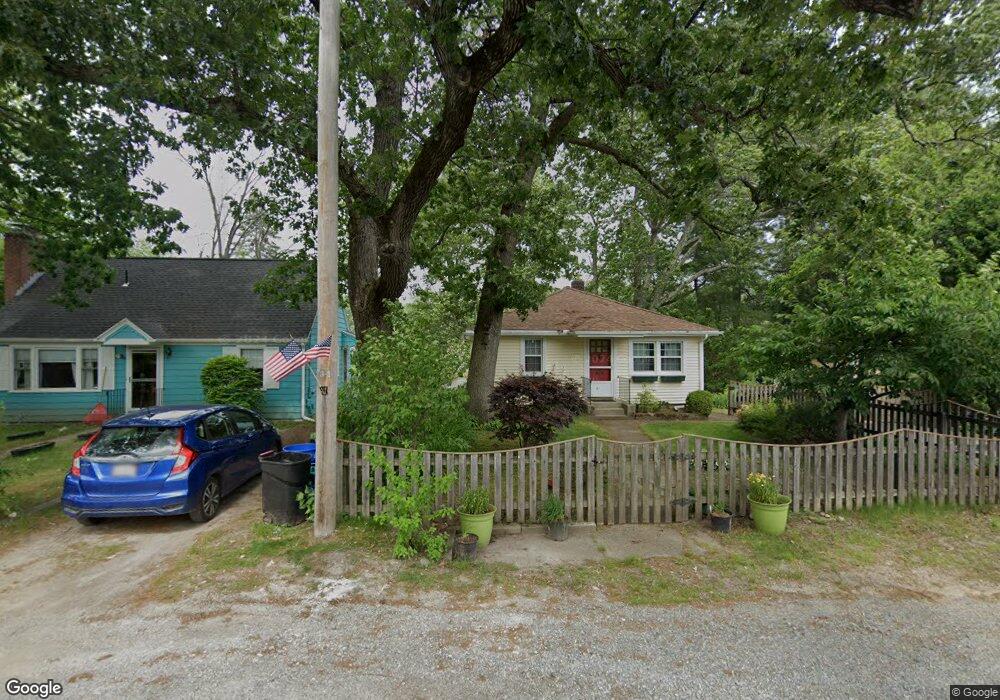
13 Hemlock St Worcester, MA 01602
Columbus Park NeighborhoodEstimated Value: $371,000 - $397,484
2
Beds
1
Bath
832
Sq Ft
$461/Sq Ft
Est. Value
About This Home
This home is located at 13 Hemlock St, Worcester, MA 01602 and is currently estimated at $383,871, approximately $461 per square foot. 13 Hemlock St is a home located in Worcester County with nearby schools including Chandler Magnet, Jacob Hiatt Magnet School, and May Street Elementary School.
Ownership History
Date
Name
Owned For
Owner Type
Purchase Details
Closed on
Sep 30, 2024
Sold by
Vangelder Catharina W
Bought by
Catharina W Van Gelder Lt and Van Gelder
Current Estimated Value
Purchase Details
Closed on
Jul 11, 1997
Sold by
Carlson John H and Carlson Betty J
Bought by
Vangelder Catharina W
Home Financials for this Owner
Home Financials are based on the most recent Mortgage that was taken out on this home.
Original Mortgage
$69,600
Interest Rate
7.86%
Mortgage Type
Purchase Money Mortgage
Create a Home Valuation Report for This Property
The Home Valuation Report is an in-depth analysis detailing your home's value as well as a comparison with similar homes in the area
Home Values in the Area
Average Home Value in this Area
Purchase History
| Date | Buyer | Sale Price | Title Company |
|---|---|---|---|
| Catharina W Van Gelder Lt | -- | None Available | |
| Catharina W Van Gelder Lt | -- | None Available | |
| Vangelder Catharina W | $87,000 | -- | |
| Vangelder Catharina W | $87,000 | -- |
Source: Public Records
Mortgage History
| Date | Status | Borrower | Loan Amount |
|---|---|---|---|
| Previous Owner | Vangelder Catharina W | $67,000 | |
| Previous Owner | Vangelder Catharina W | $69,600 |
Source: Public Records
Tax History Compared to Growth
Tax History
| Year | Tax Paid | Tax Assessment Tax Assessment Total Assessment is a certain percentage of the fair market value that is determined by local assessors to be the total taxable value of land and additions on the property. | Land | Improvement |
|---|---|---|---|---|
| 2025 | $4,977 | $377,367 | $186,667 | $190,700 |
| 2024 | $4,952 | $360,167 | $186,667 | $173,500 |
| 2023 | $4,706 | $328,153 | $162,353 | $165,800 |
| 2022 | $4,749 | $312,239 | $171,239 | $141,000 |
| 2021 | $3,766 | $231,355 | $136,955 | $94,400 |
| 2020 | $3,779 | $222,300 | $136,100 | $86,200 |
| 2019 | $2,929 | $162,700 | $81,900 | $80,800 |
| 2018 | $2,908 | $153,800 | $81,900 | $71,900 |
| 2017 | $2,916 | $151,700 | $81,900 | $69,800 |
| 2016 | $2,766 | $134,200 | $62,600 | $71,600 |
| 2015 | $2,693 | $134,200 | $62,600 | $71,600 |
| 2014 | $2,622 | $134,200 | $62,600 | $71,600 |
Source: Public Records
Map
Nearby Homes
- 34 Rosslare Dr Unit 108
- 5 Swan Ave
- 386 June St
- 32 Zenith Dr
- 45 Fourth St
- 45 Fourth St Unit Right
- 47 4th St
- 415 Mill St
- 29 Passway 5
- 57 1st St
- 114 Lovell St
- 34 Scandinavia Ave
- 33 Carlisle St
- 96 June St Unit 3
- 336 Lovell St
- 24 Hadwen Rd
- 19 Monticello Dr
- 47R Yarnie Unit 3B
- 47R Yarnie Unit 3A
- 47R Yarnie Unit 1B