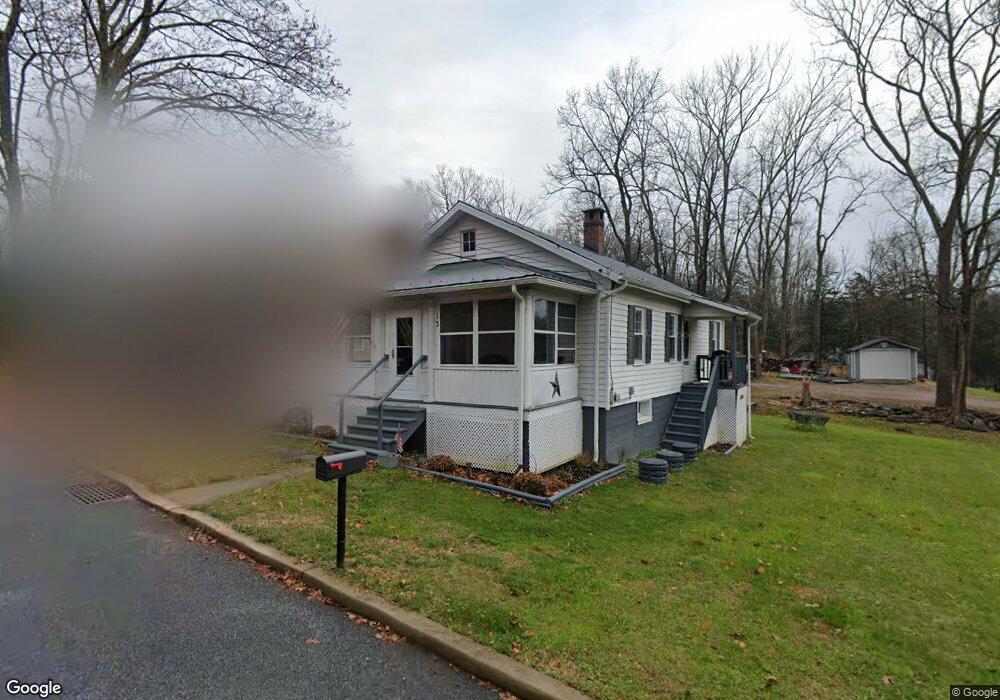
13 High St Blairstown, NJ 07825
Estimated Value: $241,905 - $359,000
--
Bed
--
Bath
936
Sq Ft
$317/Sq Ft
Est. Value
About This Home
This home is located at 13 High St, Blairstown, NJ 07825 and is currently estimated at $296,726, approximately $317 per square foot. 13 High St is a home located in Warren County with nearby schools including Blairstown Elementary School, North Warren Regional School, and Ridge & Valley Charter School.
Ownership History
Date
Name
Owned For
Owner Type
Purchase Details
Closed on
Mar 31, 2017
Sold by
King Jeffrey F
Bought by
King Jeffrey F
Current Estimated Value
Purchase Details
Closed on
Jan 20, 2016
Sold by
Maring Faye L
Bought by
King Jeffrey F
Home Financials for this Owner
Home Financials are based on the most recent Mortgage that was taken out on this home.
Original Mortgage
$108,872
Outstanding Balance
$86,332
Interest Rate
3.87%
Mortgage Type
FHA
Estimated Equity
$210,394
Purchase Details
Closed on
Nov 30, 2015
Sold by
Maring Faye L
Bought by
Maring Faye L
Home Financials for this Owner
Home Financials are based on the most recent Mortgage that was taken out on this home.
Original Mortgage
$108,872
Outstanding Balance
$86,332
Interest Rate
3.87%
Mortgage Type
FHA
Estimated Equity
$210,394
Purchase Details
Closed on
Mar 22, 2007
Sold by
Maring Faye L
Bought by
Maring Faye L
Create a Home Valuation Report for This Property
The Home Valuation Report is an in-depth analysis detailing your home's value as well as a comparison with similar homes in the area
Home Values in the Area
Average Home Value in this Area
Purchase History
| Date | Buyer | Sale Price | Title Company |
|---|---|---|---|
| King Jeffrey F | -- | None Available | |
| King Jeffrey F | $115,000 | Attorney | |
| Maring Faye L | -- | Old Republic Natl Title Ins | |
| Maring Faye L | -- | None Available |
Source: Public Records
Mortgage History
| Date | Status | Borrower | Loan Amount |
|---|---|---|---|
| Open | King Jeffrey F | $108,872 |
Source: Public Records
Tax History Compared to Growth
Tax History
| Year | Tax Paid | Tax Assessment Tax Assessment Total Assessment is a certain percentage of the fair market value that is determined by local assessors to be the total taxable value of land and additions on the property. | Land | Improvement |
|---|---|---|---|---|
| 2025 | $3,247 | $104,700 | $37,400 | $67,300 |
| 2024 | $3,017 | $104,700 | $37,400 | $67,300 |
| 2023 | $2,956 | $104,700 | $37,400 | $67,300 |
| 2022 | $2,956 | $104,700 | $37,400 | $67,300 |
| 2021 | $2,681 | $104,700 | $37,400 | $67,300 |
| 2020 | $2,588 | $104,700 | $37,400 | $67,300 |
| 2019 | $2,408 | $104,700 | $37,400 | $67,300 |
| 2018 | $2,406 | $101,600 | $37,400 | $64,200 |
| 2017 | $2,223 | $96,300 | $32,100 | $64,200 |
| 2016 | $2,230 | $96,300 | $32,100 | $64,200 |
| 2015 | $2,192 | $96,300 | $32,100 | $64,200 |
| 2014 | $2,149 | $96,300 | $32,100 | $64,200 |
Source: Public Records
Map
Nearby Homes
- 17 High St
- 16 Stillwater Rd
- 32 High St
- 6 Main St
- 12 Jones Ln
- 39 Stillwater Rd
- 18 New Jersey 94
- 14 Cedarville Rd
- 89 Millbrook Rd
- 76 Hope Rd
- 17 Bear Cave Rd
- 5 Ward Rd
- 82 Spring Valley Rd
- 42C Spring Valley Rd
- 5 Bingham Ln
- 49 Spring Valley Rd
- 1 Four Corners Rd
- 150 Silver Lake Rd
- 80 Mohican Rd
- 1054 Route94