
Landlord's Agent in 2021
Willie Skinner
W. Skinner Realty
(617) 356-8244
2 Total Sales
Estimated Value: $627,000 - $718,000
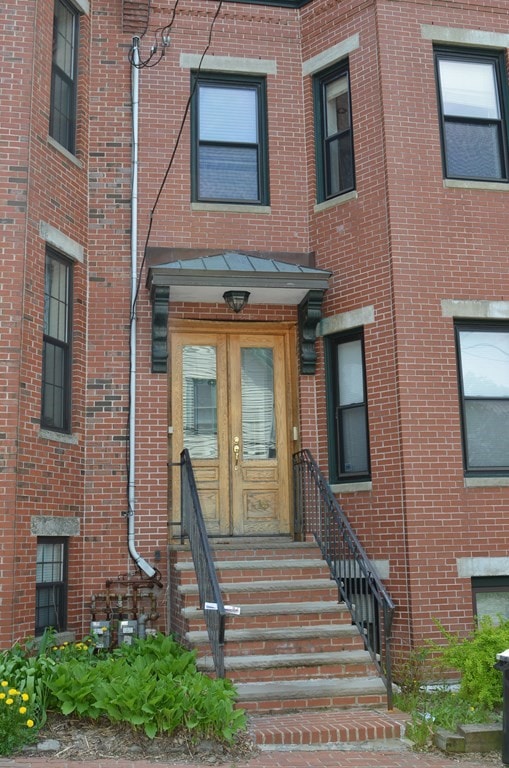
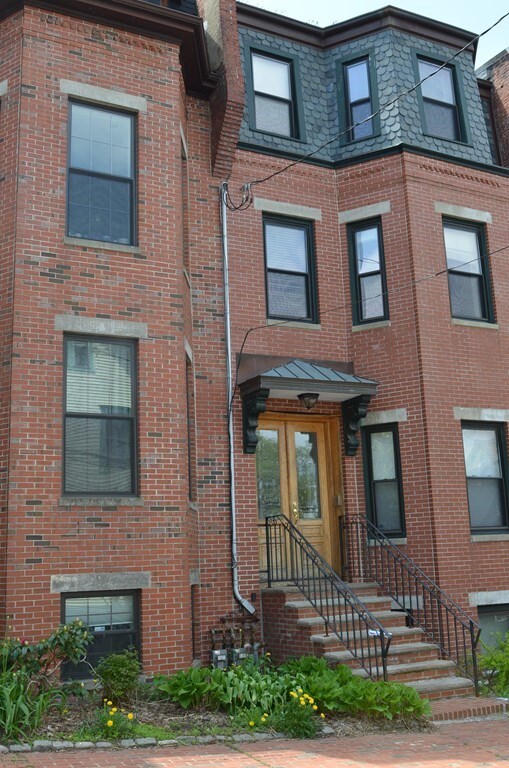
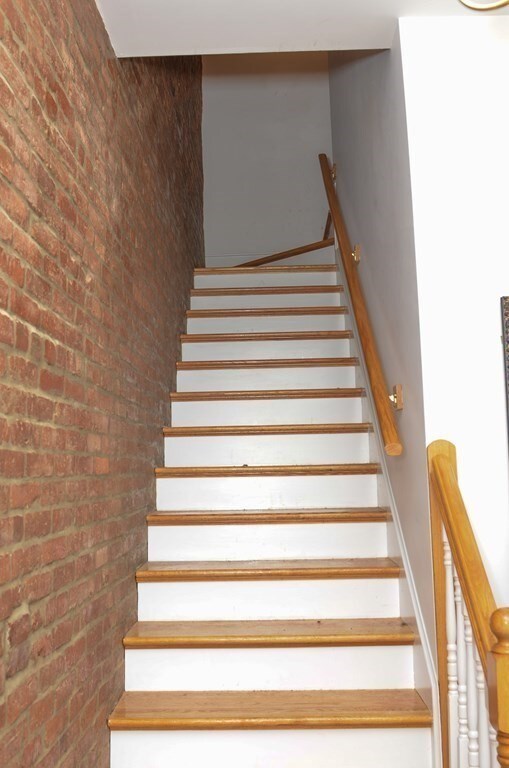
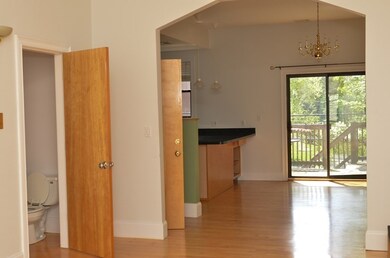
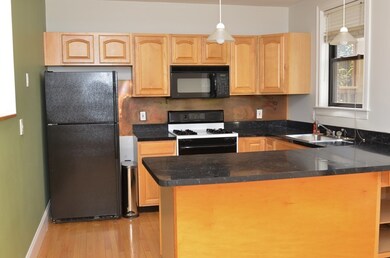
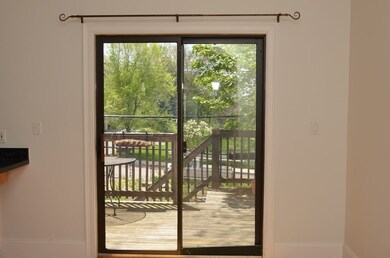
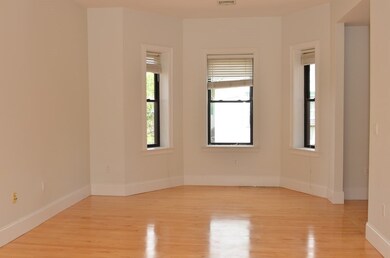
Beautiful brownstone in Fort Hill. Condo style living, unit is located in the heart of the Fort Hill area. Unit has 2 levels with central air. Unit is completely updated with excellent views of the city and surrounding areas. Large rooms, high ceilings, updated kitchen and baths,,(1.5 baths), laundry in unit, close to T orange and bus transportation , hospitals are walking distance. Great neighborhood. REFERENCES and GOOD CREDIT REQUIRED!!!! You'll love this place. Available January1,2021
| Date | Buyer | Sale Price | Title Company |
|---|---|---|---|
| Dimarco Gianni G | $330,000 | -- |
| Date | Event | Price | List to Sale | Price per Sq Ft |
|---|---|---|---|---|
| 05/01/2021 05/01/21 | Rented | $2,350 | 0.0% | -- |
| 04/17/2021 04/17/21 | Under Contract | -- | -- | -- |
| 11/23/2020 11/23/20 | For Rent | $2,350 | 0.0% | -- |
| 05/01/2020 05/01/20 | Rented | $2,350 | 0.0% | -- |
| 04/17/2020 04/17/20 | Under Contract | -- | -- | -- |
| 10/20/2019 10/20/19 | For Rent | $2,350 | 0.0% | -- |
| 10/18/2019 10/18/19 | Off Market | $2,350 | -- | -- |
| 10/06/2019 10/06/19 | Price Changed | $2,350 | -6.0% | $2 / Sq Ft |
| 07/26/2019 07/26/19 | For Rent | $2,500 | +8.7% | -- |
| 04/23/2018 04/23/18 | Rented | $2,300 | 0.0% | -- |
| 04/23/2018 04/23/18 | Under Contract | -- | -- | -- |
| 01/26/2018 01/26/18 | For Rent | $2,300 | +9.5% | -- |
| 08/25/2014 08/25/14 | Rented | $2,100 | -4.5% | -- |
| 07/26/2014 07/26/14 | Under Contract | -- | -- | -- |
| 05/14/2014 05/14/14 | For Rent | $2,200 | +22.2% | -- |
| 11/28/2012 11/28/12 | Rented | $1,800 | -21.7% | -- |
| 10/29/2012 10/29/12 | Under Contract | -- | -- | -- |
| 07/25/2012 07/25/12 | For Rent | $2,300 | -- | -- |
| Year | Tax Paid | Tax Assessment Tax Assessment Total Assessment is a certain percentage of the fair market value that is determined by local assessors to be the total taxable value of land and additions on the property. | Land | Improvement |
|---|---|---|---|---|
| 2025 | $7,180 | $620,000 | $0 | $620,000 |
| 2024 | $7,072 | $648,800 | $0 | $648,800 |
| 2023 | $6,762 | $629,600 | $0 | $629,600 |
| 2022 | $6,525 | $599,700 | $0 | $599,700 |
| 2021 | $6,399 | $599,700 | $0 | $599,700 |
| 2020 | $5,848 | $553,800 | $0 | $553,800 |
| 2019 | $5,405 | $512,800 | $0 | $512,800 |
| 2018 | $4,978 | $475,000 | $0 | $475,000 |
| 2017 | $4,699 | $443,700 | $0 | $443,700 |
| 2016 | $4,520 | $410,900 | $0 | $410,900 |
| 2015 | $4,433 | $366,100 | $0 | $366,100 |
| 2014 | $4,222 | $335,600 | $0 | $335,600 |
Landlord's Agent in 2021
Willie Skinner
W. Skinner Realty
(617) 356-8244
2 Total Sales
Tenant's Agent in 2021
Melissa Mills
Boardwalk Properties
(857) 330-0504
3 Total Sales
Seller's Agent in 2018
Peter Chan
eXp Realty
(781) 888-2426
2 Total Sales
S
Buyer's Agent in 2014
Steven Godfrey
Viceroy Realty Group
D
Buyer's Agent in 2012
David Walton
Trio Real Estate Group
Source: MLS Property Information Network (MLS PIN)
MLS Number: 72760489
APN: ROXB-000000-000011-000641-000004
Disclaimer: Certain information contained herein is derived from information provided by parties other than Homes.com. All information provided is deemed reliable, but is not guaranteed to be accurate and should be independently verified.
![]() The property listing data and information, or the Images, set forth herein were provided to MLS Property Information Network, Inc. from third party sources, including sellers, lessors and public records, and were compiled by MLS Property Information Network, Inc. The property listing data and information, and the Images, are for the personal, non-commercial use of consumers having a good faith interest in purchasing or leasing listed properties of the type displayed to them and may not be used for any purpose other than to identify prospective properties which such consumers may have a good faith interest in purchasing or leasing. MLS Property Information Network, Inc. and its subscribers disclaim any and all representations and warranties as to the accuracy of the property listing data and information, or as to the accuracy of any of the Images, set forth herein.
The property listing data and information, or the Images, set forth herein were provided to MLS Property Information Network, Inc. from third party sources, including sellers, lessors and public records, and were compiled by MLS Property Information Network, Inc. The property listing data and information, and the Images, are for the personal, non-commercial use of consumers having a good faith interest in purchasing or leasing listed properties of the type displayed to them and may not be used for any purpose other than to identify prospective properties which such consumers may have a good faith interest in purchasing or leasing. MLS Property Information Network, Inc. and its subscribers disclaim any and all representations and warranties as to the accuracy of the property listing data and information, or as to the accuracy of any of the Images, set forth herein.