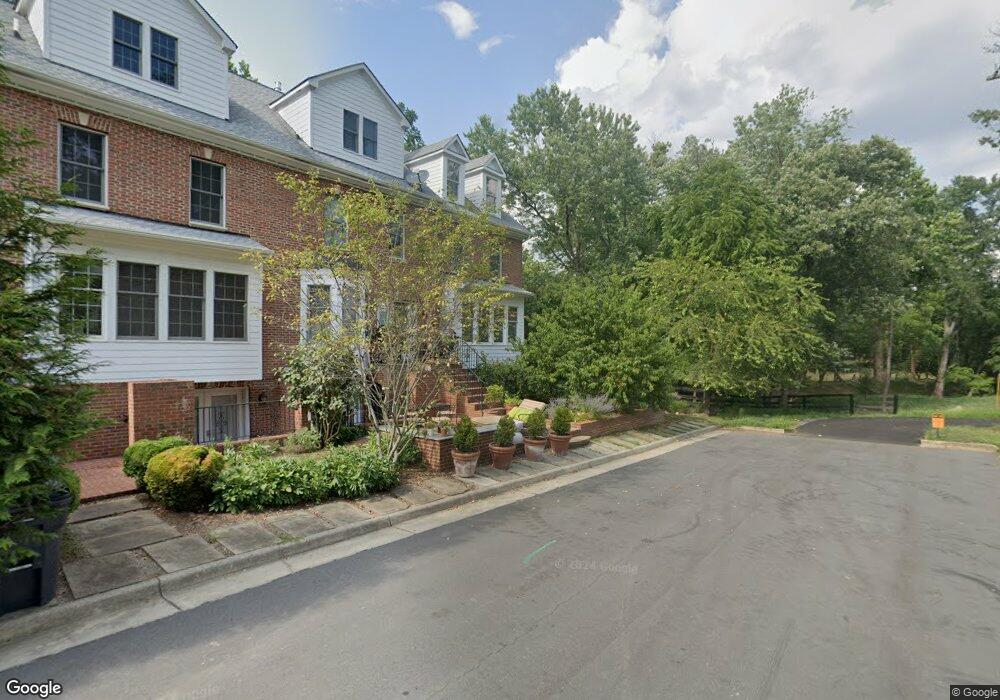
13 Hunt Ct Unit 16 Middleburg, VA 20117
Estimated Value: $665,000 - $949,000
3
Beds
4
Baths
2,300
Sq Ft
$337/Sq Ft
Est. Value
About This Home
This home is located at 13 Hunt Ct Unit 16, Middleburg, VA 20117 and is currently estimated at $774,355, approximately $336 per square foot. 13 Hunt Ct Unit 16 is a home located in Loudoun County with nearby schools including Banneker Elementary School, Blue Ridge Middle School, and Loudoun Valley High School.
Ownership History
Date
Name
Owned For
Owner Type
Purchase Details
Closed on
May 30, 2017
Sold by
Owens Marc S
Bought by
Peronto James W and Nering Kathleen W
Current Estimated Value
Home Financials for this Owner
Home Financials are based on the most recent Mortgage that was taken out on this home.
Original Mortgage
$352,000
Outstanding Balance
$292,389
Interest Rate
3.97%
Mortgage Type
New Conventional
Estimated Equity
$481,966
Purchase Details
Closed on
Dec 5, 2014
Sold by
Schaffer Trustee Nora H and The Nhs Trust
Bought by
Owens Mare S
Home Financials for this Owner
Home Financials are based on the most recent Mortgage that was taken out on this home.
Original Mortgage
$270,000
Interest Rate
3.93%
Mortgage Type
New Conventional
Create a Home Valuation Report for This Property
The Home Valuation Report is an in-depth analysis detailing your home's value as well as a comparison with similar homes in the area
Home Values in the Area
Average Home Value in this Area
Purchase History
| Date | Buyer | Sale Price | Title Company |
|---|---|---|---|
| Peronto James W | $440,000 | Attorney | |
| Owens Mare S | $420,000 | -- |
Source: Public Records
Mortgage History
| Date | Status | Borrower | Loan Amount |
|---|---|---|---|
| Open | Peronto James W | $352,000 | |
| Previous Owner | Owens Mare S | $270,000 |
Source: Public Records
Tax History Compared to Growth
Tax History
| Year | Tax Paid | Tax Assessment Tax Assessment Total Assessment is a certain percentage of the fair market value that is determined by local assessors to be the total taxable value of land and additions on the property. | Land | Improvement |
|---|---|---|---|---|
| 2025 | $4,865 | $604,290 | $180,000 | $424,290 |
| 2024 | $4,953 | $572,650 | $165,000 | $407,650 |
| 2023 | $4,748 | $542,620 | $150,000 | $392,620 |
| 2022 | $4,873 | $547,540 | $150,000 | $397,540 |
| 2021 | $4,999 | $510,070 | $150,000 | $360,070 |
| 2020 | $4,560 | $440,620 | $115,000 | $325,620 |
| 2019 | $4,527 | $433,250 | $115,000 | $318,250 |
| 2018 | $4,594 | $423,440 | $115,000 | $308,440 |
| 2017 | $4,542 | $403,690 | $115,000 | $288,690 |
| 2016 | $4,411 | $385,230 | $0 | $0 |
| 2015 | $4,338 | $267,160 | $0 | $267,160 |
| 2014 | $4,344 | $261,130 | $0 | $261,130 |
Source: Public Records
Map
Nearby Homes
- 9 Hunt Ct
- 12 Chinn Ct
- 23400 Melmore Place
- 400 Martingale Ridge Dr
- 505 Martingale Ridge Dr
- 601 Martingale Ridge Dr
- 606 Martingale Ridge Dr
- 702 Stonewall Ave
- 208 Chestnut St
- 4 Chestnut - Lot B St
- 2 Stagecoach Ridge Ln
- 4 Foxtrot Knoll Ln
- 306 Place
- 23375 Potts Mill Rd
- 35571 Millville Rd
- 35653 Millville Rd
- 22857 Carters Farm Ln
- 6437 John s Mosby Hwy
- 2547 Halfway Rd
- 35771 Snake Hill Rd
- 15 Hunt Ct
- 15 Hunt Ct Unit 17
- 13 Hunt Ct
- 9 Hunt Ct Unit 14
- 7 Hunt Ct
- 3 Hunt Ct
- 3 Hunt Ct Unit 11
- 5 Hunt Ct
- 11 Hunt Ct Unit 15
- 11 Hunt Ct
- 1 Hunt Ct
- 409 E Marshall St
- 104 Fox Run Terrace
- 102 Fox Run Terrace
- 100 Fox Run Terrace Unit 1
- 100 Fox Run Terrace
- 12 Orange Dr
- 406 E Washington St
- 119 N Jay St
- 10 Orange Dr