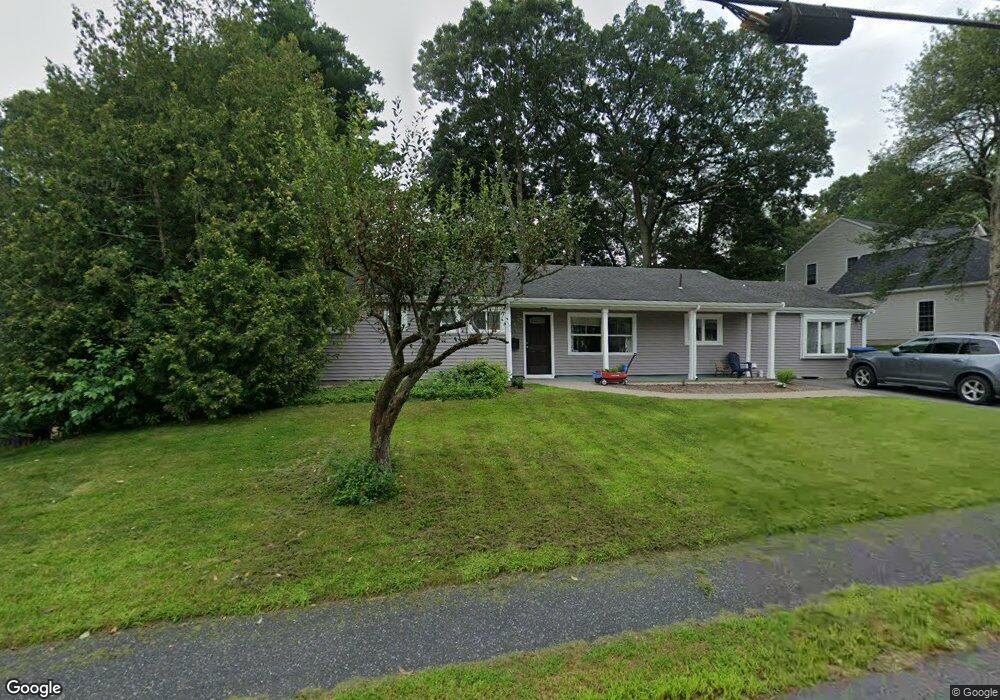
13 Irving Rd Natick, MA 01760
Estimated Value: $789,000 - $827,000
3
Beds
2
Baths
1,650
Sq Ft
$489/Sq Ft
Est. Value
About This Home
This home is located at 13 Irving Rd, Natick, MA 01760 and is currently estimated at $807,485, approximately $489 per square foot. 13 Irving Rd is a home located in Middlesex County with nearby schools including Natick High School, Bennett-Hemenway (Ben-Hem) Elementary School, and Wilson Middle School.
Ownership History
Date
Name
Owned For
Owner Type
Purchase Details
Closed on
Jun 12, 2017
Sold by
Aurilio Carolyn A
Bought by
Andersen-Davidson Samuel and Shteynberg Olga
Current Estimated Value
Home Financials for this Owner
Home Financials are based on the most recent Mortgage that was taken out on this home.
Original Mortgage
$369,750
Outstanding Balance
$307,639
Interest Rate
4.03%
Mortgage Type
New Conventional
Estimated Equity
$499,846
Purchase Details
Closed on
May 29, 1969
Bought by
Aurilio Michael and Aurilio Carolyn A
Create a Home Valuation Report for This Property
The Home Valuation Report is an in-depth analysis detailing your home's value as well as a comparison with similar homes in the area
Home Values in the Area
Average Home Value in this Area
Purchase History
| Date | Buyer | Sale Price | Title Company |
|---|---|---|---|
| Andersen-Davidson Samuel | $435,000 | -- | |
| Aurilio Michael | -- | -- |
Source: Public Records
Mortgage History
| Date | Status | Borrower | Loan Amount |
|---|---|---|---|
| Open | Andersen-Davidson Samuel | $369,750 | |
| Previous Owner | Aurilio Michael | $55,000 |
Source: Public Records
Tax History
| Year | Tax Paid | Tax Assessment Tax Assessment Total Assessment is a certain percentage of the fair market value that is determined by local assessors to be the total taxable value of land and additions on the property. | Land | Improvement |
|---|---|---|---|---|
| 2025 | $6,791 | $567,800 | $461,500 | $106,300 |
| 2024 | $6,619 | $539,900 | $435,900 | $104,000 |
| 2023 | $6,378 | $504,600 | $409,200 | $95,400 |
| 2022 | $6,211 | $465,600 | $372,400 | $93,200 |
| 2021 | $6,144 | $451,400 | $352,000 | $99,400 |
| 2020 | $0 | $452,500 | $336,700 | $115,800 |
| 2019 | $5,751 | $452,500 | $336,700 | $115,800 |
| 2018 | $8,992 | $408,500 | $306,100 | $102,400 |
| 2017 | $5,125 | $379,900 | $272,700 | $107,200 |
| 2016 | $4,938 | $363,900 | $257,700 | $106,200 |
| 2015 | $4,891 | $353,900 | $257,700 | $96,200 |
Source: Public Records
Map
Nearby Homes
Your Personal Tour Guide
Ask me questions while you tour the home.