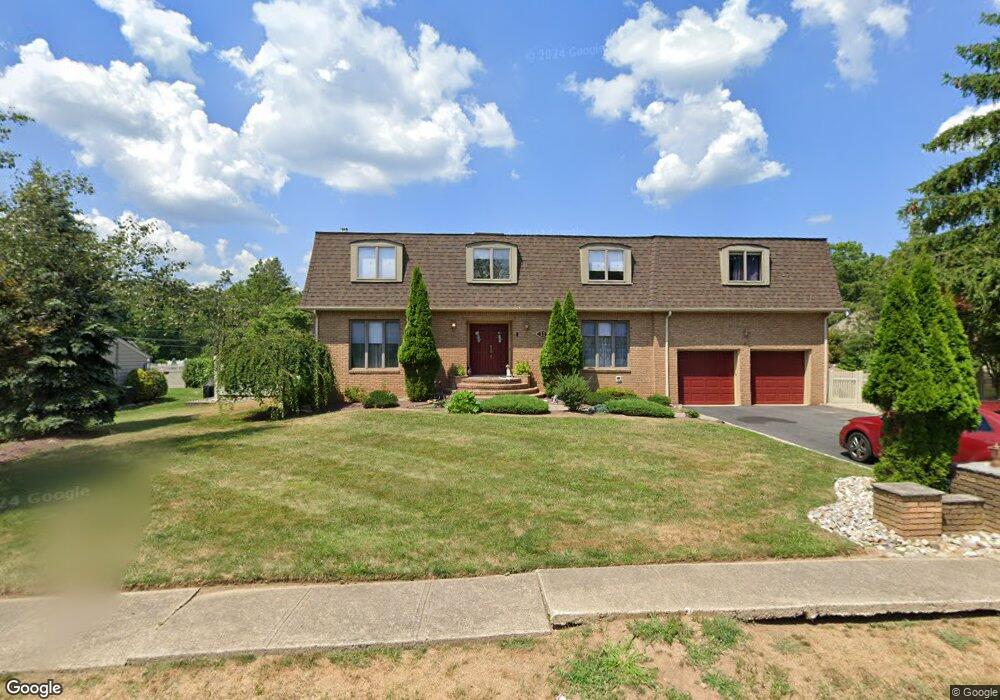
13 John St East Hanover, NJ 07936
Estimated Value: $897,000 - $1,007,000
--
Bed
--
Bath
2,980
Sq Ft
$322/Sq Ft
Est. Value
About This Home
This home is located at 13 John St, East Hanover, NJ 07936 and is currently estimated at $958,825, approximately $321 per square foot. 13 John St is a home located in Morris County with nearby schools including Frank J. Smith Elementary School, Central Elementary School, and East Hanover Middle School.
Ownership History
Date
Name
Owned For
Owner Type
Purchase Details
Closed on
Oct 4, 2005
Sold by
Romano Santo
Bought by
Sisto Nicholas and Sisto Mary K
Current Estimated Value
Home Financials for this Owner
Home Financials are based on the most recent Mortgage that was taken out on this home.
Original Mortgage
$475,000
Interest Rate
5%
Mortgage Type
Adjustable Rate Mortgage/ARM
Purchase Details
Closed on
Nov 22, 2000
Sold by
Romano Rosemarie
Bought by
Romano Santo and Romano Rosemarie
Home Financials for this Owner
Home Financials are based on the most recent Mortgage that was taken out on this home.
Original Mortgage
$312,550
Interest Rate
11.75%
Create a Home Valuation Report for This Property
The Home Valuation Report is an in-depth analysis detailing your home's value as well as a comparison with similar homes in the area
Home Values in the Area
Average Home Value in this Area
Purchase History
| Date | Buyer | Sale Price | Title Company |
|---|---|---|---|
| Sisto Nicholas | $657,500 | -- | |
| Romano Santo | -- | -- |
Source: Public Records
Mortgage History
| Date | Status | Borrower | Loan Amount |
|---|---|---|---|
| Previous Owner | Sisto Nicholas | $475,000 | |
| Previous Owner | Romano Santo | $312,550 |
Source: Public Records
Tax History Compared to Growth
Tax History
| Year | Tax Paid | Tax Assessment Tax Assessment Total Assessment is a certain percentage of the fair market value that is determined by local assessors to be the total taxable value of land and additions on the property. | Land | Improvement |
|---|---|---|---|---|
| 2025 | $11,113 | $428,400 | $154,000 | $274,400 |
| 2024 | $10,689 | $428,400 | $154,000 | $274,400 |
| 2023 | $10,689 | $428,400 | $154,000 | $274,400 |
| 2022 | $10,444 | $428,400 | $154,000 | $274,400 |
| 2021 | $10,444 | $428,400 | $154,000 | $274,400 |
| 2020 | $10,239 | $428,400 | $154,000 | $274,400 |
| 2019 | $10,050 | $428,400 | $154,000 | $274,400 |
| 2018 | $9,746 | $428,400 | $154,000 | $274,400 |
| 2017 | $9,429 | $428,400 | $154,000 | $274,400 |
| 2016 | $9,301 | $428,400 | $154,000 | $274,400 |
| 2015 | $9,168 | $428,400 | $154,000 | $274,400 |
| 2014 | $8,971 | $428,400 | $154,000 | $274,400 |
Source: Public Records
Map
Nearby Homes
- 21 Weaver Place
- 19 Petry Dr
- 4 Justin Dr
- 4 Eastwood Terrace
- Birch Plan at Valley View Park - The Signature Collection
- Pershing Plan at Valley View Park - The Pershing Collection
- Monterey Plan at Valley View Park - The Monterey Collection
- Maple Plan at Valley View Park - The Signature Collection
- 54 Grove Ave
- 59 Grove Ave
- 29 Beach St
- 12 Sunrise Dr
- 68 Eastwood Terrace
- 62 Eastwood Terrace
- 40 Grant Ave
- 65 Eastwood Terrace
- 67 Eastwood Terrace
- 69 Eastwood Terrace
- 46 Eastwood Terrace Unit 55
- 7 Eastwood Terrace