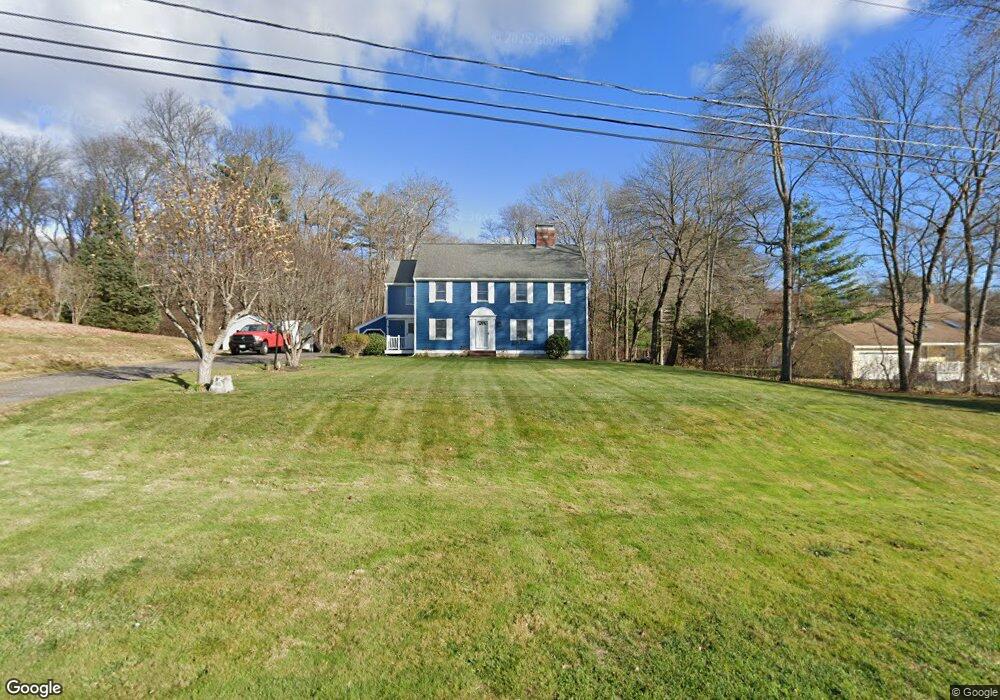
13 Joy Rd Salisbury, MA 01952
Estimated Value: $728,459 - $884,000
4
Beds
3
Baths
2,704
Sq Ft
$304/Sq Ft
Est. Value
About This Home
This home is located at 13 Joy Rd, Salisbury, MA 01952 and is currently estimated at $821,365, approximately $303 per square foot. 13 Joy Rd is a home located in Essex County with nearby schools including Triton Regional High School and Amesbury Seventh-Day Adventist School.
Ownership History
Date
Name
Owned For
Owner Type
Purchase Details
Closed on
Mar 30, 2024
Sold by
Martini Susanne G
Bought by
Susanne G Martini Ret and Martini
Current Estimated Value
Purchase Details
Closed on
Nov 6, 2006
Sold by
Derr Susanne G and Martini Susanne G
Bought by
Martini Susanne G
Create a Home Valuation Report for This Property
The Home Valuation Report is an in-depth analysis detailing your home's value as well as a comparison with similar homes in the area
Home Values in the Area
Average Home Value in this Area
Purchase History
| Date | Buyer | Sale Price | Title Company |
|---|---|---|---|
| Susanne G Martini Ret | -- | None Available | |
| Susanne G Martini Ret | -- | None Available | |
| Martini Susanne G | -- | -- | |
| Martini Susanne G | -- | -- |
Source: Public Records
Mortgage History
| Date | Status | Borrower | Loan Amount |
|---|---|---|---|
| Previous Owner | Martini Susanne G | $165,000 | |
| Previous Owner | Martini Susanne G | $165,000 |
Source: Public Records
Tax History Compared to Growth
Tax History
| Year | Tax Paid | Tax Assessment Tax Assessment Total Assessment is a certain percentage of the fair market value that is determined by local assessors to be the total taxable value of land and additions on the property. | Land | Improvement |
|---|---|---|---|---|
| 2025 | $5,939 | $589,200 | $191,800 | $397,400 |
| 2024 | $5,940 | $568,400 | $183,100 | $385,300 |
| 2023 | $5,999 | $529,200 | $183,100 | $346,100 |
| 2022 | $5,707 | $494,100 | $165,600 | $328,500 |
| 2021 | $5,598 | $465,200 | $165,600 | $299,600 |
| 2020 | $4,953 | $432,200 | $165,600 | $266,600 |
| 2019 | $5,310 | $416,500 | $165,700 | $250,800 |
| 2018 | $5,120 | $414,500 | $165,700 | $248,800 |
| 2017 | $4,795 | $379,800 | $151,100 | $228,700 |
| 2016 | $4,306 | $369,000 | $148,800 | $220,200 |
| 2015 | $4,360 | $371,100 | $137,300 | $233,800 |
Source: Public Records
Map
Nearby Homes
- 82 Monroe St
- 53 Rabbit Rd
- 7 Toll Rd
- 10 High St
- 270 Elm St
- 25 Bayberry Ln
- 204 Elm St
- 9 Elmwood St
- 1 Democracy Dr
- 191 Elm St
- 3 Birchwood Point Unit 202
- 154 Lafayette Rd
- 7 Birchwood Pointe Unit 101
- 188 Lafayette Rd
- 97 Elm St
- 5 Richs Ct Unit 3
- 25 Cedar St Unit 4
- 25 Cedar St Unit 7
- 4 Clark St
- 105 Market St Unit B