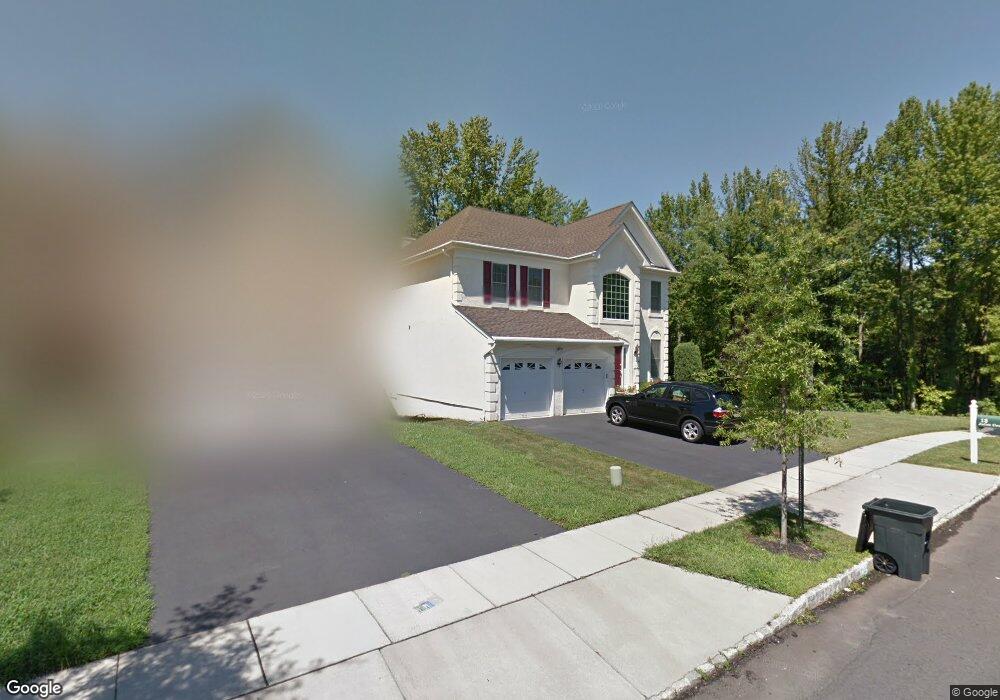
13 Juliet Ct Princeton, NJ 08540
Estimated Value: $1,167,831 - $1,371,000
--
Bed
--
Bath
2,706
Sq Ft
$466/Sq Ft
Est. Value
About This Home
This home is located at 13 Juliet Ct, Princeton, NJ 08540 and is currently estimated at $1,261,458, approximately $466 per square foot. 13 Juliet Ct is a home located in Mercer County with nearby schools including Maurice Hawk Elementary School, Millstone River School, and Community Middle School.
Ownership History
Date
Name
Owned For
Owner Type
Purchase Details
Closed on
Jul 31, 2020
Sold by
Howe Warner T
Bought by
Howe Warner T and Costa Howe Jean
Current Estimated Value
Purchase Details
Closed on
Sep 19, 2006
Sold by
Estates At Princeton Junction
Bought by
Howe Warner
Home Financials for this Owner
Home Financials are based on the most recent Mortgage that was taken out on this home.
Original Mortgage
$500,000
Outstanding Balance
$297,808
Interest Rate
6.52%
Estimated Equity
$963,650
Create a Home Valuation Report for This Property
The Home Valuation Report is an in-depth analysis detailing your home's value as well as a comparison with similar homes in the area
Home Values in the Area
Average Home Value in this Area
Purchase History
| Date | Buyer | Sale Price | Title Company |
|---|---|---|---|
| Howe Warner T | -- | Hometown Land Transfer Llc | |
| Howe Warner | $822,123 | -- | |
| -- | $822,100 | -- |
Source: Public Records
Mortgage History
| Date | Status | Borrower | Loan Amount |
|---|---|---|---|
| Open | -- | $500,000 |
Source: Public Records
Tax History Compared to Growth
Tax History
| Year | Tax Paid | Tax Assessment Tax Assessment Total Assessment is a certain percentage of the fair market value that is determined by local assessors to be the total taxable value of land and additions on the property. | Land | Improvement |
|---|---|---|---|---|
| 2025 | $22,037 | $719,000 | $240,000 | $479,000 |
| 2024 | $21,117 | $719,000 | $240,000 | $479,000 |
| 2023 | $21,117 | $719,000 | $240,000 | $479,000 |
| 2022 | $20,707 | $719,000 | $240,000 | $479,000 |
| 2021 | $20,535 | $719,000 | $240,000 | $479,000 |
| 2020 | $20,161 | $719,000 | $240,000 | $479,000 |
| 2019 | $19,931 | $719,000 | $240,000 | $479,000 |
| 2018 | $19,744 | $719,000 | $240,000 | $479,000 |
| 2017 | $19,334 | $719,000 | $240,000 | $479,000 |
| 2016 | $18,917 | $719,000 | $240,000 | $479,000 |
| 2015 | $18,478 | $719,000 | $240,000 | $479,000 |
| 2014 | $18,263 | $719,000 | $240,000 | $479,000 |
Source: Public Records
Map
Nearby Homes