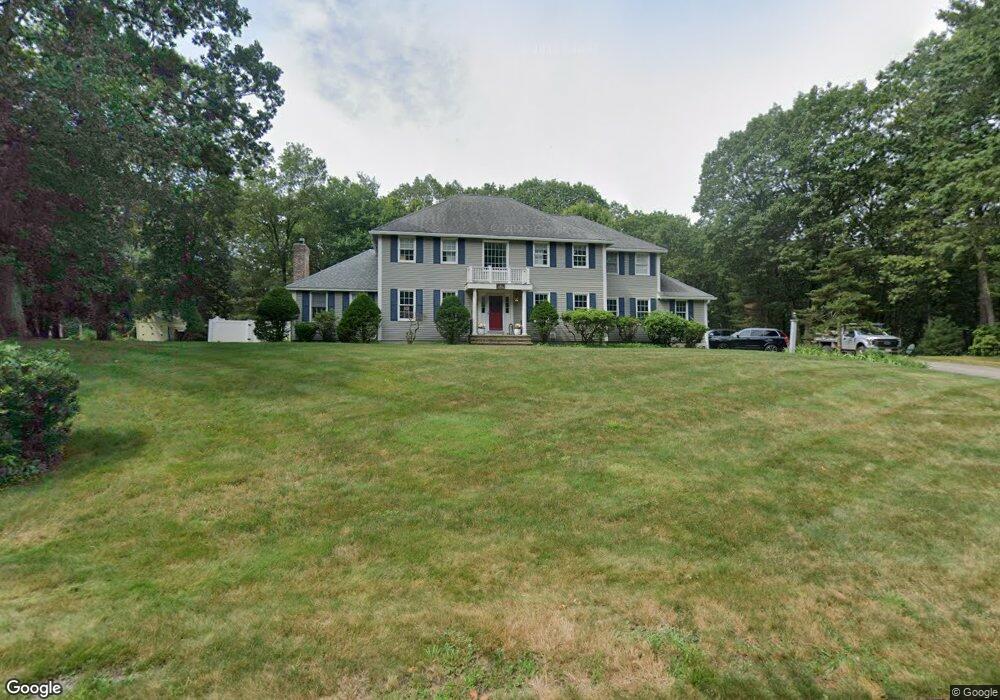
13 Kylemore Dr Westford, MA 01886
Estimated Value: $1,061,000 - $1,256,000
4
Beds
4
Baths
3,072
Sq Ft
$378/Sq Ft
Est. Value
About This Home
This home is located at 13 Kylemore Dr, Westford, MA 01886 and is currently estimated at $1,160,613, approximately $377 per square foot. 13 Kylemore Dr is a home located in Middlesex County with nearby schools including Rita E. Miller Elementary School, Day Elementary School, and Blanchard Middle School.
Ownership History
Date
Name
Owned For
Owner Type
Purchase Details
Closed on
Nov 1, 2021
Sold by
Kylemore 13 Rt
Bought by
Stegner James and Stegner Jessica
Current Estimated Value
Home Financials for this Owner
Home Financials are based on the most recent Mortgage that was taken out on this home.
Original Mortgage
$886,500
Outstanding Balance
$810,158
Interest Rate
2.8%
Mortgage Type
Purchase Money Mortgage
Estimated Equity
$350,455
Purchase Details
Closed on
Aug 30, 2004
Sold by
Sliwa Matthew J and Sliwa Therese M
Bought by
Kylemore 13 Rt and Sliwa Matthew J
Purchase Details
Closed on
Aug 17, 1993
Sold by
Paulson Gary D and Paulson Donna M
Bought by
Sliwa Matthew and Sliwa Therese M
Home Financials for this Owner
Home Financials are based on the most recent Mortgage that was taken out on this home.
Original Mortgage
$75,000
Interest Rate
7.16%
Mortgage Type
Purchase Money Mortgage
Create a Home Valuation Report for This Property
The Home Valuation Report is an in-depth analysis detailing your home's value as well as a comparison with similar homes in the area
Home Values in the Area
Average Home Value in this Area
Purchase History
| Date | Buyer | Sale Price | Title Company |
|---|---|---|---|
| Stegner James | $985,000 | None Available | |
| Kylemore 13 Rt | -- | -- | |
| Sliwa Matthew | $345,000 | -- |
Source: Public Records
Mortgage History
| Date | Status | Borrower | Loan Amount |
|---|---|---|---|
| Open | Stegner James | $886,500 | |
| Previous Owner | Sliwa Matthew | $100,000 | |
| Previous Owner | Sliwa Matthew | $100,000 | |
| Previous Owner | Sliwa Matthew | $100,000 | |
| Previous Owner | Sliwa Matthew | $75,000 |
Source: Public Records
Tax History
| Year | Tax Paid | Tax Assessment Tax Assessment Total Assessment is a certain percentage of the fair market value that is determined by local assessors to be the total taxable value of land and additions on the property. | Land | Improvement |
|---|---|---|---|---|
| 2025 | $14,747 | $1,094,800 | $324,100 | $770,700 |
| 2024 | $14,737 | $1,070,200 | $332,500 | $737,700 |
| 2023 | $14,522 | $983,900 | $316,500 | $667,400 |
| 2022 | $13,610 | $844,300 | $280,000 | $564,300 |
| 2021 | $12,678 | $761,900 | $280,000 | $481,900 |
| 2020 | $12,510 | $766,100 | $280,000 | $486,100 |
| 2019 | $12,074 | $729,100 | $280,000 | $449,100 |
| 2018 | $11,585 | $716,000 | $270,100 | $445,900 |
| 2017 | $11,049 | $673,300 | $270,100 | $403,200 |
| 2016 | $11,045 | $677,600 | $272,800 | $404,800 |
| 2015 | $10,847 | $667,900 | $262,700 | $405,200 |
| 2014 | $10,287 | $619,700 | $252,800 | $366,900 |
Source: Public Records
Map
Nearby Homes
- 3 Hillside Ave
- 3 Cheyenne Valley Unit 3
- 7 3rd St
- 11 River St
- 66 Patten Rd
- 35 Forge Village Rd
- 23 Apache Way Unit 23
- 12 Patten Rd
- 8 Bixby Ln
- 82 Pleasant St
- 34 West St
- 17 Maple St
- 6 Colonel Rolls Dr
- 41 Flagg Rd
- 38 Groton Rd
- 76 Beaver Brook Rd
- 62 Main St
- 59 Main St
- 8 Boston Rd
- 2 Lady Constance Way Unit 19
Your Personal Tour Guide
Ask me questions while you tour the home.