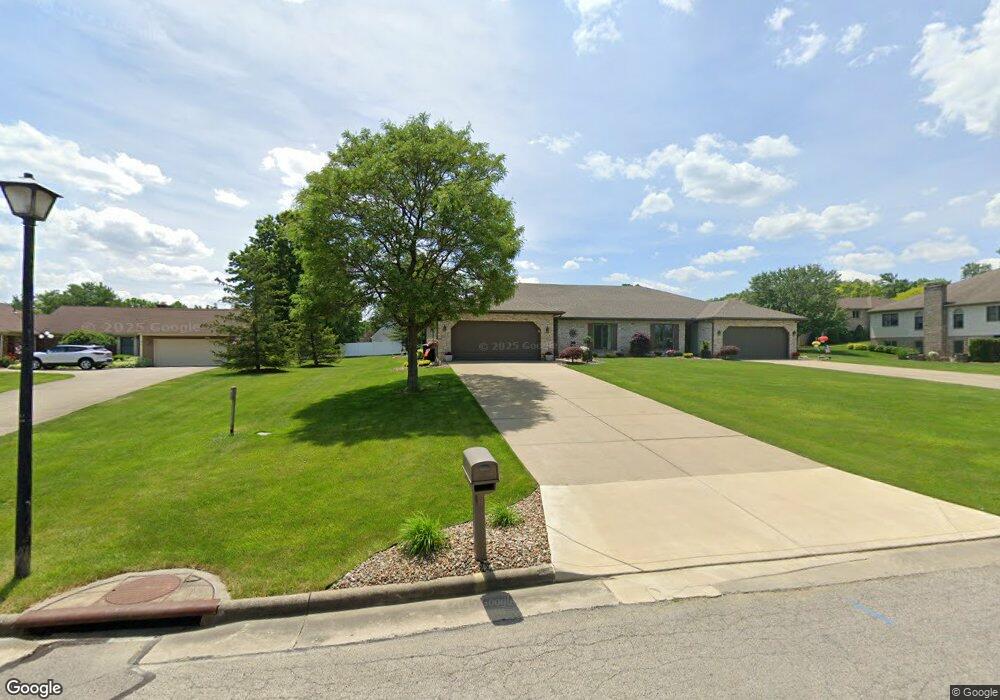
13 Lakeview Cir Canfield, OH 44406
Estimated Value: $344,876 - $446,000
4
Beds
4
Baths
3,351
Sq Ft
$117/Sq Ft
Est. Value
About This Home
This home is located at 13 Lakeview Cir, Canfield, OH 44406 and is currently estimated at $392,219, approximately $117 per square foot. 13 Lakeview Cir is a home located in Mahoning County with nearby schools including Canfield Village Middle School and Canfield High School.
Ownership History
Date
Name
Owned For
Owner Type
Purchase Details
Closed on
Jul 13, 2021
Bought by
Fusco Joseph M Trustee
Current Estimated Value
Purchase Details
Closed on
Oct 26, 2020
Sold by
Cerimele Robert A
Bought by
Fusco Joseph M and Fusco Joyce L
Purchase Details
Closed on
Oct 30, 2018
Sold by
Cerimele Cynthia M
Bought by
Cerimele Robert A
Purchase Details
Closed on
Jun 6, 2011
Sold by
Cerimele Robert A
Bought by
Cerimele Cynthia M
Purchase Details
Closed on
Feb 24, 2006
Sold by
Greco Anthony W
Bought by
Cerimele Robert A
Home Financials for this Owner
Home Financials are based on the most recent Mortgage that was taken out on this home.
Original Mortgage
$125,000
Interest Rate
6.2%
Mortgage Type
Fannie Mae Freddie Mac
Purchase Details
Closed on
Aug 7, 1991
Bought by
Greco Anthony W
Create a Home Valuation Report for This Property
The Home Valuation Report is an in-depth analysis detailing your home's value as well as a comparison with similar homes in the area
Home Values in the Area
Average Home Value in this Area
Purchase History
| Date | Buyer | Sale Price | Title Company |
|---|---|---|---|
| Fusco Joseph M Trustee | -- | -- | |
| Fusco Joseph M | $240,000 | None Available | |
| Cerimele Robert A | -- | None Available | |
| Cerimele Cynthia M | -- | Attorney | |
| Cerimele Robert A | $225,000 | None Available | |
| Greco Anthony W | -- | -- |
Source: Public Records
Mortgage History
| Date | Status | Borrower | Loan Amount |
|---|---|---|---|
| Previous Owner | Cerimele Robert A | $125,000 |
Source: Public Records
Tax History Compared to Growth
Tax History
| Year | Tax Paid | Tax Assessment Tax Assessment Total Assessment is a certain percentage of the fair market value that is determined by local assessors to be the total taxable value of land and additions on the property. | Land | Improvement |
|---|---|---|---|---|
| 2024 | $4,442 | $111,850 | $14,530 | $97,320 |
| 2023 | $4,399 | $111,850 | $14,530 | $97,320 |
| 2022 | $4,337 | $89,340 | $14,440 | $74,900 |
| 2021 | $4,210 | $89,340 | $14,440 | $74,900 |
| 2020 | $4,681 | $89,340 | $14,440 | $74,900 |
| 2019 | $4,446 | $77,020 | $12,450 | $64,570 |
| 2018 | $4,391 | $77,020 | $12,450 | $64,570 |
| 2017 | $3,898 | $77,020 | $12,450 | $64,570 |
| 2016 | $3,408 | $60,890 | $11,000 | $49,890 |
| 2015 | $3,334 | $60,890 | $11,000 | $49,890 |
| 2014 | $3,348 | $60,890 | $11,000 | $49,890 |
| 2013 | $3,228 | $60,890 | $11,000 | $49,890 |
Source: Public Records
Map
Nearby Homes
- 830 Blueberry Hill Dr
- 191 Saybrook Dr
- 755 Blueberry Hill Dr
- 675 Blueberry Hill Dr
- 301 Timber Run Dr
- 365 Sleepy Hollow Dr
- 0 Lake Wobegon Dr Unit 5104965
- 0 Lake Wobegon Dr Unit 5104960
- 0 Lake Wobegon Dr Unit 5104948
- 0 Lake Wobegon Dr Unit 5104946
- 6264 Herbert Rd
- 520 Stoneybrook Ln
- 0 Grayson Dr
- 225 Sleepy Hollow Dr
- 230 Deer Trail Ave
- 7515 N Palmyra Rd
- 331 Verdant Ln
- 7251 N Palmyra Rd
- 90 Villa Theresa Ln
- 6170 Deer Spring Run
- 11 Lakeview Cir Unit 13
- 21 Lakeview Cir Unit B
- 21 Lakeview Cir Unit A
- 21 Lakeview Cir
- 23 Lakeview Cir Unit B
- 23 Lakeview Cir
- 535 Shadydale Dr
- 537 Shadydale Dr
- 525 Shadydale Dr
- 523 Shadydale Dr Unit 523
- 567 Greenmont Dr
- 33 Lakeview Cir
- 12 Lakeview Cir
- 31 Lakeview Cir Unit 33
- 559 Greenmont Dr
- 553 Shadydale Dr
- 32 Lakeview Cir
- 20 Lakeview Cir Unit 22
- 30 Lakeview Cir
- 551 Shadydale Dr