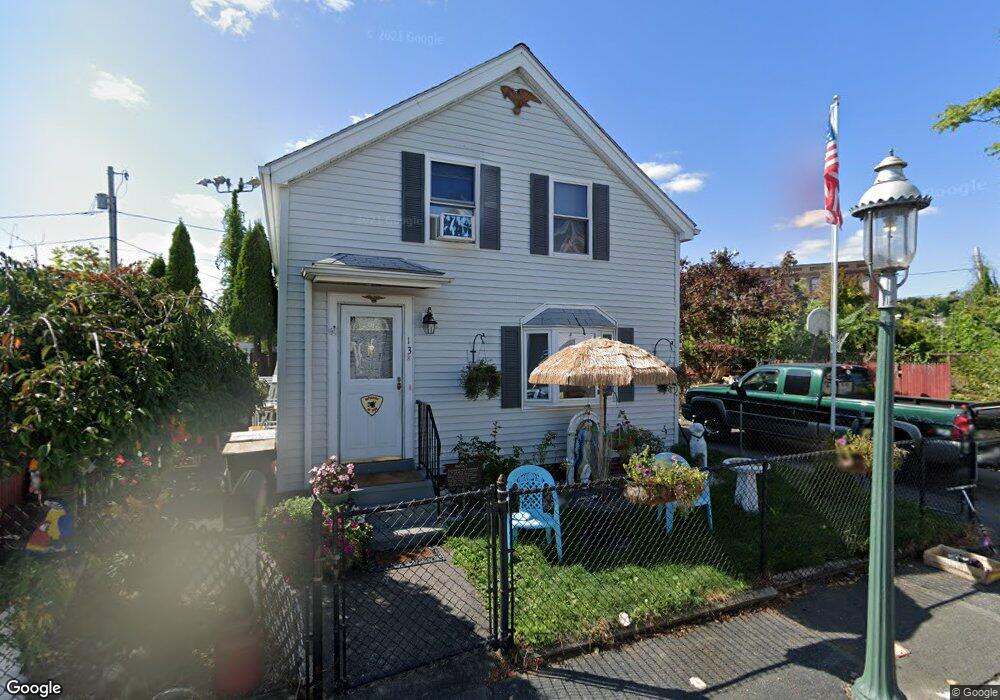
13 Langdon St Worcester, MA 01608
Green Island NeighborhoodEstimated Value: $213,000 - $387,000
3
Beds
3
Baths
900
Sq Ft
$364/Sq Ft
Est. Value
About This Home
This home is located at 13 Langdon St, Worcester, MA 01608 and is currently estimated at $328,020, approximately $364 per square foot. 13 Langdon St is a home located in Worcester County with nearby schools including Jacob Hiatt Magnet School, Chandler Elementary Community School, and Chandler Magnet.
Ownership History
Date
Name
Owned For
Owner Type
Purchase Details
Closed on
Oct 22, 2025
Sold by
Nichols Paula F Est and Nichols
Bought by
Nichols April and Nichols Donald R
Current Estimated Value
Purchase Details
Closed on
Sep 5, 2024
Sold by
Nichols Paula F Est and Nichols
Bought by
Nichols Donald R
Purchase Details
Closed on
Jul 28, 1999
Sold by
Stuart Jayne Marie and Mikutaitis Judith
Bought by
Bartkiewicz Paula F
Home Financials for this Owner
Home Financials are based on the most recent Mortgage that was taken out on this home.
Original Mortgage
$40,850
Interest Rate
7.54%
Create a Home Valuation Report for This Property
The Home Valuation Report is an in-depth analysis detailing your home's value as well as a comparison with similar homes in the area
Home Values in the Area
Average Home Value in this Area
Purchase History
| Date | Buyer | Sale Price | Title Company |
|---|---|---|---|
| Nichols April | -- | -- | |
| Nichols Donald R | -- | None Available | |
| Nichols Donald R | -- | None Available | |
| Bartkiewicz Paula F | $10,300 | -- | |
| Bartkiewicz Paula F | $10,300 | -- |
Source: Public Records
Mortgage History
| Date | Status | Borrower | Loan Amount |
|---|---|---|---|
| Previous Owner | Bartkiewicz Paula F | $40,850 | |
| Previous Owner | Bartkiewicz Paula F | $46,900 |
Source: Public Records
Tax History
| Year | Tax Paid | Tax Assessment Tax Assessment Total Assessment is a certain percentage of the fair market value that is determined by local assessors to be the total taxable value of land and additions on the property. | Land | Improvement |
|---|---|---|---|---|
| 2025 | $3,251 | $246,500 | $57,500 | $189,000 |
| 2024 | $3,090 | $224,700 | $57,500 | $167,200 |
| 2023 | $2,933 | $204,500 | $46,200 | $158,300 |
| 2022 | $2,729 | $179,400 | $36,900 | $142,500 |
| 2021 | $2,584 | $158,700 | $29,600 | $129,100 |
| 2020 | $2,443 | $143,700 | $29,600 | $114,100 |
| 2019 | $2,399 | $133,300 | $29,300 | $104,000 |
| 2018 | $2,386 | $126,200 | $29,300 | $96,900 |
| 2017 | $2,230 | $116,000 | $29,300 | $86,700 |
| 2016 | $2,300 | $111,600 | $24,100 | $87,500 |
| 2015 | $2,240 | $111,600 | $24,100 | $87,500 |
| 2014 | $2,181 | $111,600 | $24,100 | $87,500 |
Source: Public Records
Map
Nearby Homes
- 13 Sigel St
- 69 Oread St
- 195 Millbury St
- 709 Main St
- 49 Richland St
- 70 Southbridge St Unit 611
- 70 Southbridge St Unit 310
- 64 Green St
- 82 Fox St
- 2 Preston St
- 4 Preston St
- 13 Sterling St
- 1 Arlington St
- 22 Waverly St
- 12 King St
- 5 Ripley Place
- 531 Main St Unit 410
- 531 Main St Unit 403
- 17 Federal St Unit 210
- 32 Providence St Unit 5
Your Personal Tour Guide
Ask me questions while you tour the home.