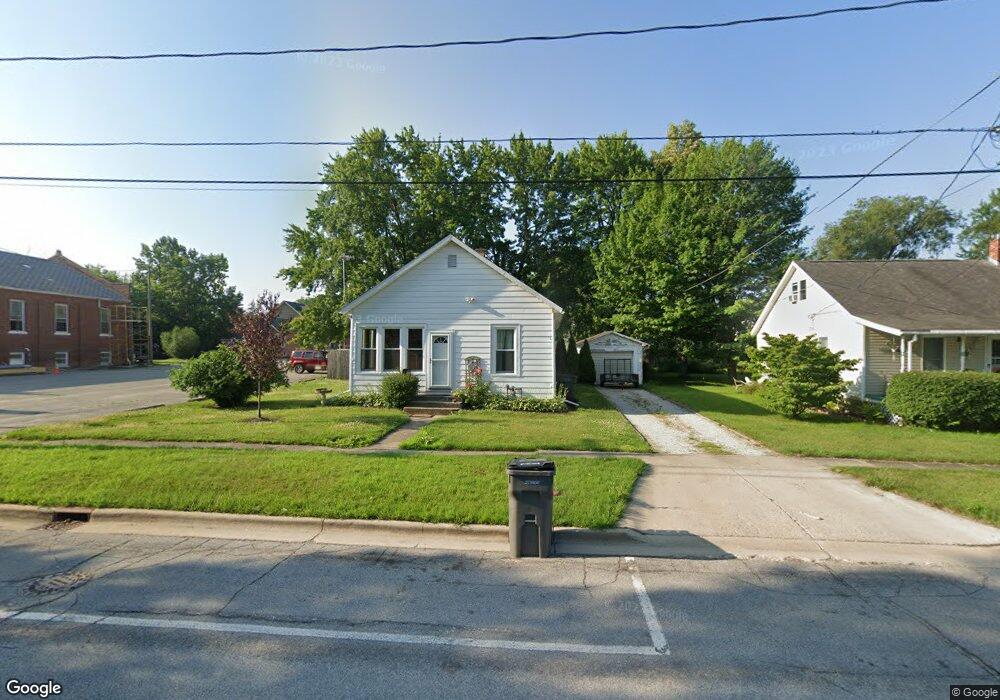
13 Linden St W Three Oaks, MI 49128
Estimated Value: $211,000 - $290,000
3
Beds
1
Bath
1,152
Sq Ft
$216/Sq Ft
Est. Value
About This Home
This home is located at 13 Linden St W, Three Oaks, MI 49128 and is currently estimated at $248,758, approximately $215 per square foot. 13 Linden St W is a home located in Berrien County with nearby schools including River Valley Middle/High School and Lutie High School.
Ownership History
Date
Name
Owned For
Owner Type
Purchase Details
Closed on
Sep 19, 2003
Sold by
Swords Rodger and Swords Susan
Bought by
Styburski Sandra L
Current Estimated Value
Home Financials for this Owner
Home Financials are based on the most recent Mortgage that was taken out on this home.
Original Mortgage
$55,200
Outstanding Balance
$26,047
Interest Rate
6.49%
Mortgage Type
Purchase Money Mortgage
Estimated Equity
$222,711
Purchase Details
Closed on
Apr 8, 2003
Sold by
Christ Jeremy
Bought by
Swords Rodger L and Swords Susan E
Purchase Details
Closed on
Jul 1, 2000
Purchase Details
Closed on
Jun 27, 2000
Purchase Details
Closed on
Feb 8, 1995
Create a Home Valuation Report for This Property
The Home Valuation Report is an in-depth analysis detailing your home's value as well as a comparison with similar homes in the area
Home Values in the Area
Average Home Value in this Area
Purchase History
| Date | Buyer | Sale Price | Title Company |
|---|---|---|---|
| Styburski Sandra L | $53,809 | Chicago Title Of Michigan | |
| Swords Rodger L | -- | -- | |
| -- | $61,000 | -- | |
| -- | $55,500 | -- | |
| -- | -- | -- |
Source: Public Records
Mortgage History
| Date | Status | Borrower | Loan Amount |
|---|---|---|---|
| Open | Styburski Sandra L | $55,200 |
Source: Public Records
Tax History Compared to Growth
Tax History
| Year | Tax Paid | Tax Assessment Tax Assessment Total Assessment is a certain percentage of the fair market value that is determined by local assessors to be the total taxable value of land and additions on the property. | Land | Improvement |
|---|---|---|---|---|
| 2025 | $964 | $73,800 | $0 | $0 |
| 2024 | $1,139 | $67,100 | $0 | $0 |
| 2023 | $1,084 | $67,200 | $0 | $0 |
| 2022 | $1,042 | $54,600 | $0 | $0 |
| 2021 | $1,472 | $50,000 | $11,000 | $39,000 |
| 2020 | $1,382 | $37,300 | $0 | $0 |
| 2019 | $1,320 | $37,000 | $5,500 | $31,500 |
| 2018 | $1,292 | $37,000 | $0 | $0 |
| 2017 | $1,268 | $37,229 | $0 | $0 |
| 2016 | $1,247 | $36,586 | $0 | $0 |
| 2015 | $1,244 | $39,828 | $0 | $0 |
| 2014 | $372 | $37,132 | $0 | $0 |
Source: Public Records
Map
Nearby Homes