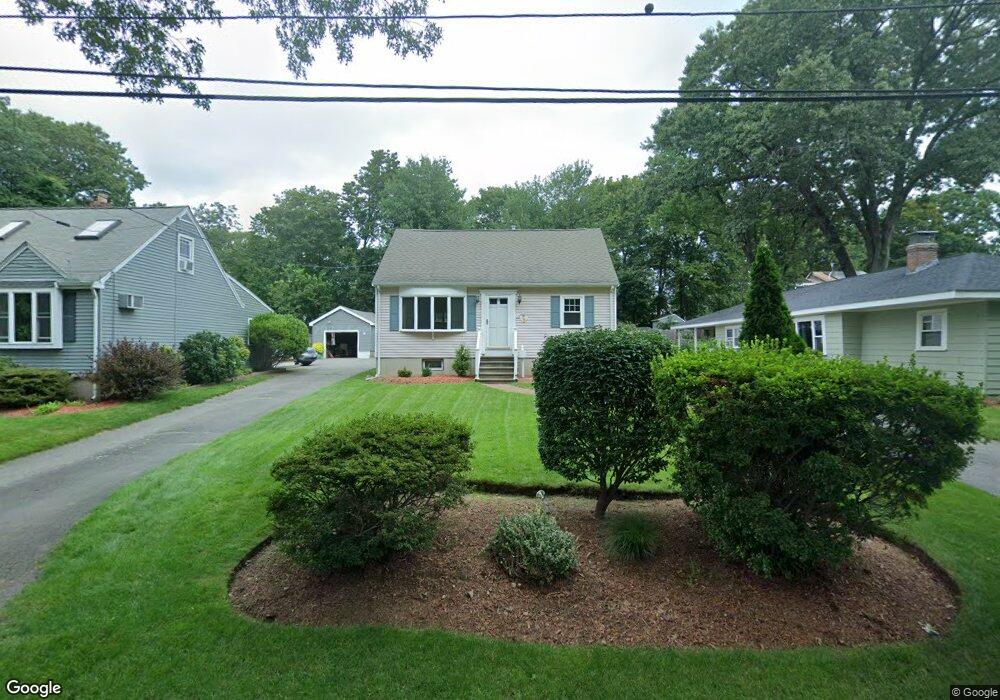
13 Lowell Rd Natick, MA 01760
Estimated Value: $713,000 - $758,000
1
Bed
1
Bath
1,476
Sq Ft
$502/Sq Ft
Est. Value
About This Home
This home is located at 13 Lowell Rd, Natick, MA 01760 and is currently estimated at $741,448, approximately $502 per square foot. 13 Lowell Rd is a home located in Middlesex County with nearby schools including Natick High School, Bennett-Hemenway (Ben-Hem) Elementary School, and Wilson Middle School.
Ownership History
Date
Name
Owned For
Owner Type
Purchase Details
Closed on
Nov 29, 1990
Sold by
Devereaux Gerald R
Bought by
Vlass Timothy J
Current Estimated Value
Home Financials for this Owner
Home Financials are based on the most recent Mortgage that was taken out on this home.
Original Mortgage
$95,000
Interest Rate
10.16%
Mortgage Type
Purchase Money Mortgage
Create a Home Valuation Report for This Property
The Home Valuation Report is an in-depth analysis detailing your home's value as well as a comparison with similar homes in the area
Home Values in the Area
Average Home Value in this Area
Purchase History
| Date | Buyer | Sale Price | Title Company |
|---|---|---|---|
| Vlass Timothy J | $135,000 | -- |
Source: Public Records
Mortgage History
| Date | Status | Borrower | Loan Amount |
|---|---|---|---|
| Open | Vlass Timothy J | $98,618 | |
| Closed | Vlass Timothy J | $25,000 | |
| Closed | Vlass Timothy J | $105,000 | |
| Closed | Vlass Timothy J | $95,000 |
Source: Public Records
Tax History
| Year | Tax Paid | Tax Assessment Tax Assessment Total Assessment is a certain percentage of the fair market value that is determined by local assessors to be the total taxable value of land and additions on the property. | Land | Improvement |
|---|---|---|---|---|
| 2025 | $7,787 | $651,100 | $418,100 | $233,000 |
| 2024 | $7,551 | $615,900 | $393,500 | $222,400 |
| 2023 | $7,494 | $592,900 | $378,700 | $214,200 |
| 2022 | $7,093 | $531,700 | $344,300 | $187,400 |
| 2021 | $6,789 | $498,800 | $324,600 | $174,200 |
| 2020 | $6,589 | $484,100 | $309,900 | $174,200 |
| 2019 | $6,153 | $484,100 | $309,900 | $174,200 |
| 2018 | $5,197 | $398,200 | $295,100 | $103,100 |
| 2017 | $4,750 | $352,100 | $250,800 | $101,300 |
| 2016 | $4,466 | $329,100 | $228,700 | $100,400 |
| 2015 | $4,432 | $320,700 | $228,700 | $92,000 |
Source: Public Records
Map
Nearby Homes
- 278 N Main St
- 50 Wethersfield Rd
- 340 N Main St
- 293 Bacon St Unit A
- 4 Richard Rd
- 1 Richard Rd
- 5 Griffin Cir
- 136 Commonwealth Rd
- 29 Irving Rd
- 25 Irving Rd
- 7 Jackson Ct Unit B
- 8 Liberty St
- 27 2nd St
- 45 W Plain St Unit 1
- 40 Nouvelle Way Unit 441
- 44 Harwood Rd
- 186 Main St
- 16 Arlington Rd
- 37 Longfellow Rd
- 5 Haven Ln
Your Personal Tour Guide
Ask me questions while you tour the home.