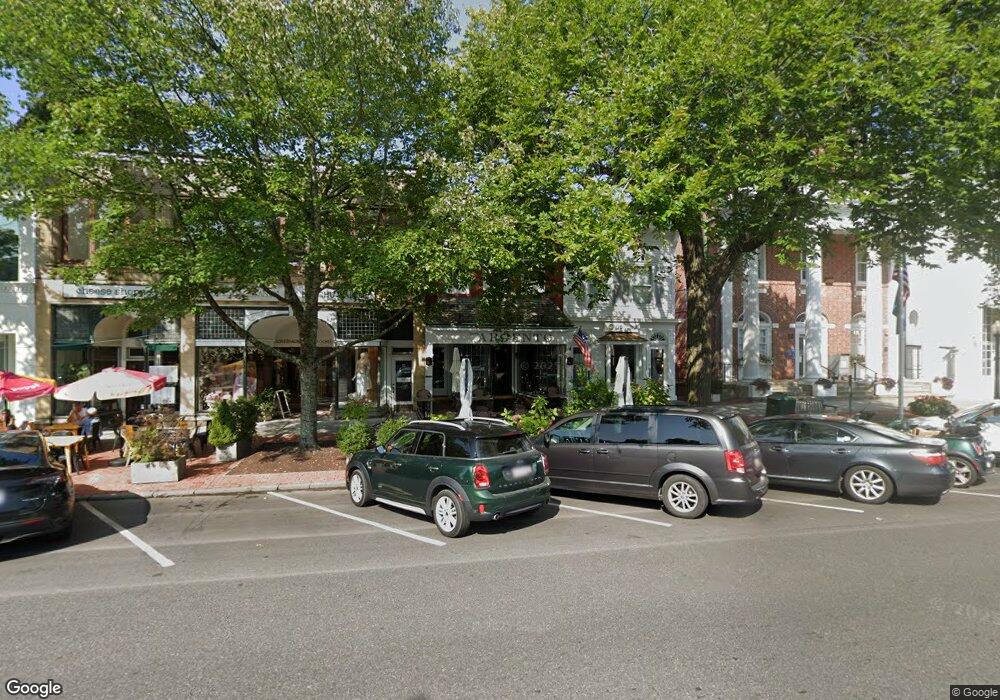
13 Main St Southampton, NY 11968
Estimated Value: $3,058,000
--
Bed
--
Bath
2,923
Sq Ft
$1,046/Sq Ft
Est. Value
About This Home
This home is located at 13 Main St, Southampton, NY 11968 and is currently estimated at $3,058,000, approximately $1,046 per square foot. 13 Main St is a home with nearby schools including Southampton Elementary School, Southampton Intermediate School, and Southampton High School.
Ownership History
Date
Name
Owned For
Owner Type
Purchase Details
Closed on
Dec 11, 2012
Sold by
Wellins Garrett Lee
Bought by
G Wellins Llc
Current Estimated Value
Purchase Details
Closed on
Sep 27, 2000
Sold by
A Daniel Wellins Revocable Trust and Wellins Garrett Lee
Bought by
Wellins Garrett Lee
Purchase Details
Closed on
Aug 21, 2000
Sold by
Wellins Garrett Lee
Bought by
Wellins Garrett Lee
Purchase Details
Closed on
Jan 27, 2000
Sold by
Wellins A Daniel
Bought by
Wellins A Daniel and Wellins Garrett Lee
Create a Home Valuation Report for This Property
The Home Valuation Report is an in-depth analysis detailing your home's value as well as a comparison with similar homes in the area
Home Values in the Area
Average Home Value in this Area
Purchase History
| Date | Buyer | Sale Price | Title Company |
|---|---|---|---|
| G Wellins Llc | -- | -- | |
| Wellins Garrett Lee | -- | Commonwealth Land Title Ins | |
| Wellins Garrett Lee | -- | Commonwealth Land Title Ins | |
| Wellins Arthur Daniel | -- | Commonwealth Land Title Ins | |
| Wellins A Daniel | -- | -- |
Source: Public Records
Tax History Compared to Growth
Tax History
| Year | Tax Paid | Tax Assessment Tax Assessment Total Assessment is a certain percentage of the fair market value that is determined by local assessors to be the total taxable value of land and additions on the property. | Land | Improvement |
|---|---|---|---|---|
| 2024 | $2,999 | $1,187,200 | $655,200 | $532,000 |
| 2023 | $2,999 | $1,187,200 | $655,200 | $532,000 |
| 2022 | $3,888 | $1,187,200 | $655,200 | $532,000 |
| 2021 | $3,888 | $1,187,200 | $655,200 | $532,000 |
| 2020 | $6,350 | $1,187,200 | $655,200 | $532,000 |
| 2019 | $6,246 | $0 | $0 | $0 |
| 2018 | -- | $1,187,200 | $655,200 | $532,000 |
| 2017 | $3,586 | $1,187,200 | $655,200 | $532,000 |
| 2016 | $3,744 | $1,187,200 | $655,200 | $532,000 |
| 2015 | -- | $1,187,200 | $655,200 | $532,000 |
| 2014 | -- | $1,187,200 | $655,200 | $532,000 |
Source: Public Records
Map
Nearby Homes