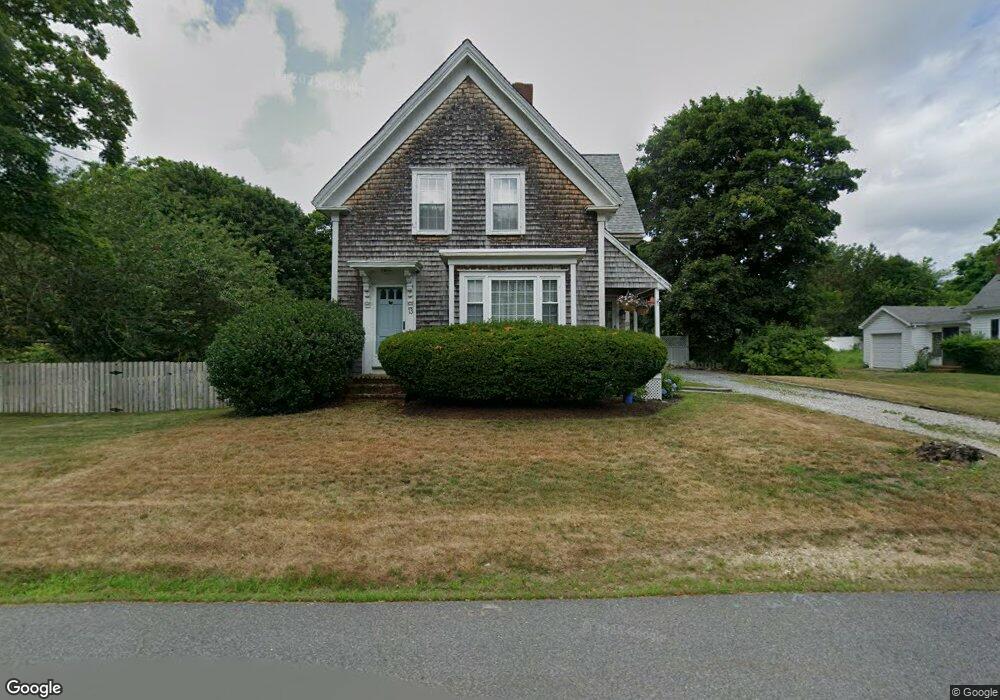
13 Maple Ave Kingston, MA 02364
Estimated Value: $600,000 - $654,000
3
Beds
3
Baths
1,751
Sq Ft
$361/Sq Ft
Est. Value
About This Home
This home is located at 13 Maple Ave, Kingston, MA 02364 and is currently estimated at $632,701, approximately $361 per square foot. 13 Maple Ave is a home located in Plymouth County with nearby schools including Kingston Elementary School, Silver Lake Regional High School, and Kingston Intermediate School.
Ownership History
Date
Name
Owned For
Owner Type
Purchase Details
Closed on
Jul 28, 2020
Sold by
Nugent Shawn P
Bought by
Sullivan Zachary and Hardey Lisa
Current Estimated Value
Home Financials for this Owner
Home Financials are based on the most recent Mortgage that was taken out on this home.
Original Mortgage
$436,500
Outstanding Balance
$384,461
Interest Rate
3.1%
Mortgage Type
New Conventional
Estimated Equity
$248,241
Purchase Details
Closed on
Mar 28, 2017
Sold by
Nugent Shawn P and Nugent Melissa
Bought by
Nugent Shawn P
Purchase Details
Closed on
Jun 22, 2015
Sold by
Colman Margaret R
Bought by
Nugent Shawn P and Nugent Melissa
Home Financials for this Owner
Home Financials are based on the most recent Mortgage that was taken out on this home.
Original Mortgage
$309,294
Interest Rate
3.5%
Mortgage Type
FHA
Purchase Details
Closed on
Dec 6, 1968
Bought by
Nugent Shawn P and Nugent Melissa
Create a Home Valuation Report for This Property
The Home Valuation Report is an in-depth analysis detailing your home's value as well as a comparison with similar homes in the area
Home Values in the Area
Average Home Value in this Area
Purchase History
| Date | Buyer | Sale Price | Title Company |
|---|---|---|---|
| Sullivan Zachary | $450,000 | None Available | |
| Nugent Shawn P | -- | -- | |
| Nugent Shawn P | $315,000 | -- | |
| Nugent Shawn P | -- | -- |
Source: Public Records
Mortgage History
| Date | Status | Borrower | Loan Amount |
|---|---|---|---|
| Open | Sullivan Zachary | $436,500 | |
| Previous Owner | Nugent Shawn P | $309,294 | |
| Previous Owner | Nugent Shawn P | $30,000 | |
| Previous Owner | Nugent Shawn P | $90,000 | |
| Previous Owner | Nugent Shawn P | $17,000 | |
| Previous Owner | Nugent Shawn P | $85,000 |
Source: Public Records
Tax History
| Year | Tax Paid | Tax Assessment Tax Assessment Total Assessment is a certain percentage of the fair market value that is determined by local assessors to be the total taxable value of land and additions on the property. | Land | Improvement |
|---|---|---|---|---|
| 2025 | $7,329 | $565,100 | $215,800 | $349,300 |
| 2024 | $6,819 | $536,500 | $215,800 | $320,700 |
| 2023 | $6,321 | $473,100 | $215,800 | $257,300 |
| 2022 | $6,301 | $432,200 | $191,300 | $240,900 |
| 2021 | $6,083 | $378,300 | $191,300 | $187,000 |
| 2020 | $6,159 | $378,300 | $191,300 | $187,000 |
| 2019 | $5,684 | $345,300 | $191,300 | $154,000 |
| 2018 | $5,378 | $326,900 | $191,300 | $135,600 |
| 2017 | $5,047 | $305,900 | $171,400 | $134,500 |
| 2016 | $4,570 | $259,500 | $162,000 | $97,500 |
| 2015 | $4,418 | $260,800 | $162,000 | $98,800 |
| 2014 | $4,262 | $255,500 | $156,700 | $98,800 |
Source: Public Records
Map
Nearby Homes
- 10 Wapping Rd
- Lot 17-1 Howland's Ln
- 138 Elm St Unit 30
- 138 Elm St Unit 38
- 2 Clinton Terrace
- 40 Landing Rd
- 149 Summer St
- 35 Grove St
- 1 Oldfield Dr
- 16 Copper Beech Dr Marion Dr
- 100 Parks St Unit 32
- 342 Country Club Way
- 74 Tussock Brook Rd Unit 74
- 46 Foxworth Ln
- 735 Bay Rd
- 44 Bay Farm Rd
- 40 Bay Farm Rd Unit 40
- 83 Wapping Rd
- 58 Bay Farm Rd
- 111 Loring St
Your Personal Tour Guide
Ask me questions while you tour the home.