Estimated Value: $289,302 - $361,000
--
Bed
--
Bath
1,955
Sq Ft
$168/Sq Ft
Est. Value
About This Home
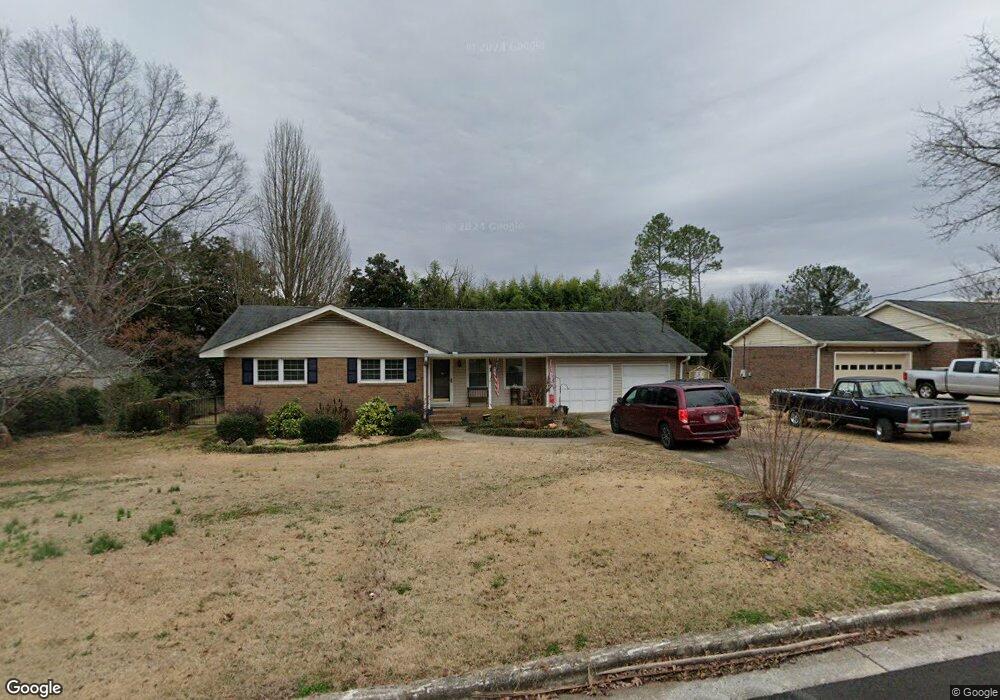
This home is located at 13 Maplewood Square SE, Rome, GA 30161 and is currently estimated at $327,826, approximately $167 per square foot. 13 Maplewood Square SE is a home located in Floyd County with nearby schools including Rome High School, St. Mary School, and Darlington School.
Ownership History
Date
Name
Owned For
Owner Type
Purchase Details
Closed on
Nov 13, 2006
Sold by
Not Provided
Bought by
Bennett Jeffery O and Bennett Rebecca S
Current Estimated Value
Home Financials for this Owner
Home Financials are based on the most recent Mortgage that was taken out on this home.
Original Mortgage
$149,350
Outstanding Balance
$88,837
Interest Rate
6.31%
Mortgage Type
New Conventional
Estimated Equity
$238,989
Purchase Details
Closed on
Dec 15, 1993
Sold by
Riedell Charles A
Bought by
Dickerson Doris M
Purchase Details
Closed on
Sep 18, 1973
Sold by
Harvey Tom
Bought by
Riedell Charles A
Purchase Details
Closed on
Jun 6, 1969
Sold by
Williams Const Co Of Rome
Bought by
Harvey Tom
Purchase Details
Closed on
Apr 5, 1968
Sold by
Howell Howell and Howell Covington
Bought by
Williams Const Co Of Rome
Purchase Details
Closed on
Aug 15, 1967
Bought by
Howell Howell and Howell Covington
Create a Home Valuation Report for This Property
The Home Valuation Report is an in-depth analysis detailing your home's value as well as a comparison with similar homes in the area
Home Values in the Area
Average Home Value in this Area
Purchase History
| Date | Buyer | Sale Price | Title Company |
|---|---|---|---|
| Bennett Jeffery O | -- | -- | |
| Bennett Jeffery O | $149,350 | -- | |
| Dickerson Doris M | $82,000 | -- | |
| P | -- | -- | |
| Riedell Charles A | $31,900 | -- | |
| Harvey Tom | $21,700 | -- | |
| Williams Const Co Of Rome | -- | -- | |
| Howell Howell | -- | -- |
Source: Public Records
Mortgage History
| Date | Status | Borrower | Loan Amount |
|---|---|---|---|
| Open | Bennett Jeffery O | $149,350 | |
| Closed | Bennett Jeffery O | $149,350 |
Source: Public Records
Tax History Compared to Growth
Tax History
| Year | Tax Paid | Tax Assessment Tax Assessment Total Assessment is a certain percentage of the fair market value that is determined by local assessors to be the total taxable value of land and additions on the property. | Land | Improvement |
|---|---|---|---|---|
| 2024 | $2,621 | $92,704 | $13,056 | $79,648 |
| 2023 | $2,602 | $88,216 | $11,832 | $76,384 |
| 2022 | $2,341 | $72,960 | $9,792 | $63,168 |
| 2021 | $2,171 | $61,064 | $9,792 | $51,272 |
| 2020 | $2,074 | $56,740 | $7,548 | $49,192 |
| 2019 | $1,974 | $54,598 | $7,548 | $47,050 |
| 2018 | $1,890 | $52,336 | $7,548 | $44,788 |
| 2017 | $1,855 | $51,384 | $7,548 | $43,836 |
| 2016 | $1,839 | $50,800 | $7,520 | $43,280 |
| 2015 | $1,821 | $51,600 | $7,520 | $44,080 |
| 2014 | $1,821 | $53,191 | $7,520 | $45,671 |
Source: Public Records
Map
Nearby Homes
- 26 Maplewood Square SE
- 22 Oakfield Dr SE
- 20 Mitchell Cir SE
- 100 Valley Brook Dr SE
- 4 Mitchell Cir SE
- 14 Laurchris Dr SE
- 9 Heather Rd SE
- 227 W Lakeshore Dr SE
- 0 Lakeshore Dr
- 120 Keown Rd SE
- 6 Woodland Dr SE
- 11 Surrey Trail SE
- 4 Coach Trail SE
- 15 Mimosa Dr SE
- 226 Maplecrest Ln SE
- 11 Breckenridge Rd SE
- 13 Breckenridge Rd SE
- 0 Georgia 293
- 8 Covey Rise Dr SE
- 15 Maplewood Square SE
- 11 Maplewood Square SE
- 10 Maplewood Square
- 35 Maplewood Square SE
- 33 Maplewood Square SE
- 17 Maplewood Square SE
- 8 Maplewood Square SE
- 37 Maplewood Square SE
- 4 Maplewood Square SE
- 31 Maplewood Square SE
- 9 Maplewood Square SE
- 2 Maplewood Square SE
- 39 Maplewood Square SE
- 19 Maplewood Square SE
- 19 Maplewood Square SE
- 19 Maplewood Square SE Unit 34
- 29 Maplewood Square SE
- 0 Maplewood Square SE Unit 8214816
- 0 Maplewood Square SE Unit 8093502
- 0 Maplewood Square SE Unit 8035883