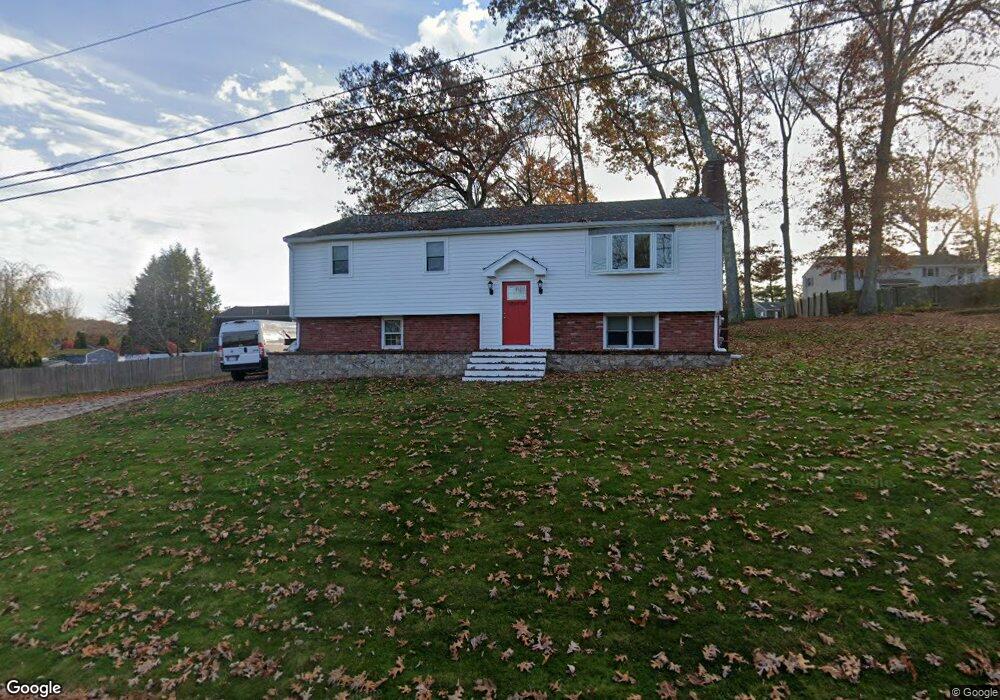
13 Marquand Ln Newburyport, MA 01950
Estimated Value: $606,000 - $879,000
3
Beds
2
Baths
1,144
Sq Ft
$654/Sq Ft
Est. Value
About This Home
This home is located at 13 Marquand Ln, Newburyport, MA 01950 and is currently estimated at $747,721, approximately $653 per square foot. 13 Marquand Ln is a home located in Essex County with nearby schools including Francis T. Bresnahan Elementary School, Edward G. Molin Elementary School, and Rupert A. Nock Middle School.
Ownership History
Date
Name
Owned For
Owner Type
Purchase Details
Closed on
Jan 28, 1987
Sold by
Corporon Ashley G
Bought by
Corporon Ronald A
Current Estimated Value
Home Financials for this Owner
Home Financials are based on the most recent Mortgage that was taken out on this home.
Original Mortgage
$93,000
Interest Rate
9.26%
Mortgage Type
Purchase Money Mortgage
Create a Home Valuation Report for This Property
The Home Valuation Report is an in-depth analysis detailing your home's value as well as a comparison with similar homes in the area
Home Values in the Area
Average Home Value in this Area
Purchase History
| Date | Buyer | Sale Price | Title Company |
|---|---|---|---|
| Corporon Ronald A | $170,000 | -- |
Source: Public Records
Mortgage History
| Date | Status | Borrower | Loan Amount |
|---|---|---|---|
| Open | Corporon Ronald A | $30,000 | |
| Closed | Corporon Ronald A | $78,000 | |
| Closed | Corporon Ronald A | $93,000 |
Source: Public Records
Tax History Compared to Growth
Tax History
| Year | Tax Paid | Tax Assessment Tax Assessment Total Assessment is a certain percentage of the fair market value that is determined by local assessors to be the total taxable value of land and additions on the property. | Land | Improvement |
|---|---|---|---|---|
| 2025 | $6,338 | $661,600 | $398,400 | $263,200 |
| 2024 | $6,234 | $625,300 | $362,100 | $263,200 |
| 2023 | $5,963 | $555,200 | $314,900 | $240,300 |
| 2022 | $5,546 | $461,800 | $262,400 | $199,400 |
| 2021 | $4,998 | $395,400 | $238,600 | $156,800 |
| 2020 | $5,077 | $395,400 | $238,600 | $156,800 |
| 2019 | $5,172 | $395,400 | $238,600 | $156,800 |
| 2018 | $5,018 | $378,400 | $227,200 | $151,200 |
| 2017 | $4,898 | $364,200 | $216,400 | $147,800 |
| 2016 | $4,739 | $353,900 | $206,100 | $147,800 |
| 2015 | $4,377 | $328,100 | $206,100 | $122,000 |
Source: Public Records
Map
Nearby Homes
- 15 Marquand Ln
- 53 Longfellow Dr
- 11 Marquand Ln
- 51 Longfellow Dr
- 55 Longfellow Dr
- 14 Marquand Ln
- 14 Hawthorne Rd
- 17 Marquand Ln
- 16 Marquand Ln
- 21 Newhall Ln
- 10 Marquand Ln
- 57 Longfellow Dr
- 9 Marquand Ln
- 49 Longfellow Dr
- 60 Longfellow Dr
- 17 Newhall Ln
- 62 Longfellow Dr
- 12 Hawthorne Rd
- 15 Newhall Ln
- 58 Longfellow Dr