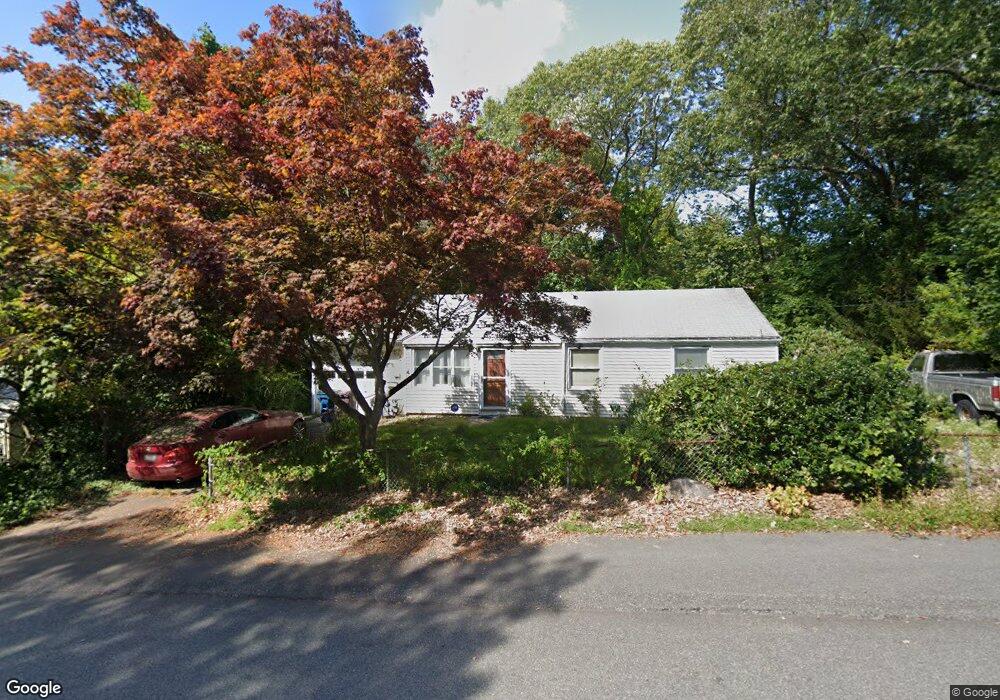
13 Mars St Weymouth, MA 02188
South Weymouth NeighborhoodEstimated Value: $512,707 - $582,000
3
Beds
1
Bath
912
Sq Ft
$604/Sq Ft
Est. Value
About This Home
This home is located at 13 Mars St, Weymouth, MA 02188 and is currently estimated at $550,677, approximately $603 per square foot. 13 Mars St is a home located in Norfolk County with nearby schools including Thomas V Nash, Abigail Adams Middle School, and Weymouth Middle School Chapman.
Ownership History
Date
Name
Owned For
Owner Type
Purchase Details
Closed on
Dec 8, 2000
Sold by
Anrhein J Christopher
Bought by
Chernicki Francis J and Chernicki Anh N
Current Estimated Value
Home Financials for this Owner
Home Financials are based on the most recent Mortgage that was taken out on this home.
Original Mortgage
$161,900
Outstanding Balance
$59,404
Interest Rate
7.64%
Mortgage Type
Purchase Money Mortgage
Estimated Equity
$491,273
Create a Home Valuation Report for This Property
The Home Valuation Report is an in-depth analysis detailing your home's value as well as a comparison with similar homes in the area
Home Values in the Area
Average Home Value in this Area
Purchase History
| Date | Buyer | Sale Price | Title Company |
|---|---|---|---|
| Chernicki Francis J | $179,900 | -- |
Source: Public Records
Mortgage History
| Date | Status | Borrower | Loan Amount |
|---|---|---|---|
| Open | Chernicki Francis J | $161,900 |
Source: Public Records
Tax History
| Year | Tax Paid | Tax Assessment Tax Assessment Total Assessment is a certain percentage of the fair market value that is determined by local assessors to be the total taxable value of land and additions on the property. | Land | Improvement |
|---|---|---|---|---|
| 2025 | $4,469 | $442,500 | $208,000 | $234,500 |
| 2024 | $4,325 | $421,100 | $198,100 | $223,000 |
| 2023 | $4,115 | $393,800 | $183,400 | $210,400 |
| 2022 | $4,067 | $354,900 | $169,900 | $185,000 |
| 2021 | $3,718 | $316,700 | $169,900 | $146,800 |
| 2020 | $3,508 | $294,300 | $169,900 | $124,400 |
| 2019 | $3,409 | $281,300 | $163,300 | $118,000 |
| 2018 | $3,311 | $264,900 | $155,500 | $109,400 |
| 2017 | $3,204 | $250,100 | $148,200 | $101,900 |
| 2016 | $3,078 | $240,500 | $142,500 | $98,000 |
| 2015 | $3,008 | $233,200 | $142,500 | $90,700 |
| 2014 | $2,753 | $207,000 | $119,300 | $87,700 |
Source: Public Records
Map
Nearby Homes
- 300 West St
- 501 Commerce Dr Unit 2310
- 501 Commerce Dr Unit 4308
- 17 Berean Way
- 73 Ryder Rd
- 432 Grove St
- 2 Mitchell Ln Unit B
- 68 Massapoag St Unit 7
- 972 Liberty St
- 257 Allerton Commons Ln
- 27 Park Ave
- 54 Old Quarry Dr
- 8 Tara Dr Unit 4
- 8 Tara Dr Unit 5
- 30 Alroy Rd
- 55 Bradford Commons Ln Unit 55
- 193 Randolph St
- 211 Randolph St
- 139 Randolph St
- 82 Lester Ln
Your Personal Tour Guide
Ask me questions while you tour the home.