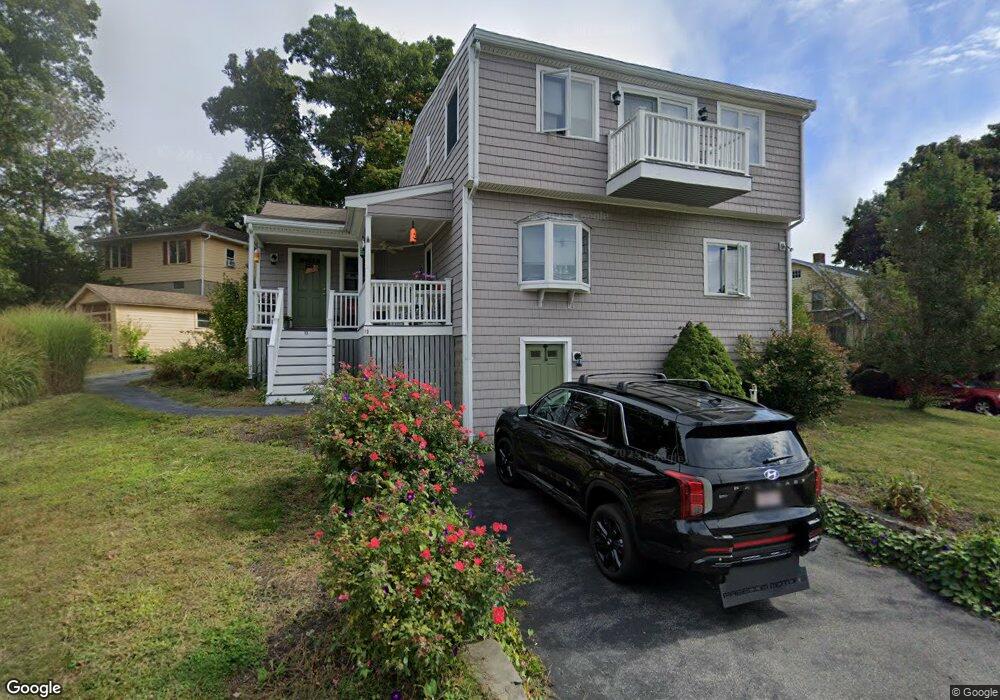
13 Meadow Rd Hingham, MA 02043
Estimated Value: $833,674 - $966,000
3
Beds
2
Baths
2,098
Sq Ft
$427/Sq Ft
Est. Value
About This Home
This home is located at 13 Meadow Rd, Hingham, MA 02043 and is currently estimated at $894,919, approximately $426 per square foot. 13 Meadow Rd is a home located in Plymouth County with nearby schools including East Elementary School, Hingham Middle School, and Hingham High School.
Ownership History
Date
Name
Owned For
Owner Type
Purchase Details
Closed on
Apr 27, 2012
Sold by
Thorne Diane M
Bought by
Richardson Kimberly and Thorne Lauri
Current Estimated Value
Purchase Details
Closed on
Mar 9, 2012
Sold by
Thorne Budd K and Thorne Diane M
Bought by
Thorne Diane M
Purchase Details
Closed on
May 15, 1972
Bought by
Thorne Diane M
Create a Home Valuation Report for This Property
The Home Valuation Report is an in-depth analysis detailing your home's value as well as a comparison with similar homes in the area
Purchase History
| Date | Buyer | Sale Price | Title Company |
|---|---|---|---|
| Richardson Kimberly | -- | -- | |
| Thorne Diane M | -- | -- | |
| Thorne Diane M | $15,000 | -- |
Source: Public Records
Mortgage History
| Date | Status | Borrower | Loan Amount |
|---|---|---|---|
| Previous Owner | Thorne Diane M | $40,000 | |
| Previous Owner | Thorne Diane M | $20,000 | |
| Previous Owner | Thorne Diane M | $40,000 |
Source: Public Records
Tax History
| Year | Tax Paid | Tax Assessment Tax Assessment Total Assessment is a certain percentage of the fair market value that is determined by local assessors to be the total taxable value of land and additions on the property. | Land | Improvement |
|---|---|---|---|---|
| 2025 | $7,410 | $693,200 | $358,300 | $334,900 |
| 2024 | $7,208 | $664,300 | $358,300 | $306,000 |
| 2023 | $6,370 | $637,000 | $358,300 | $278,700 |
| 2022 | $6,158 | $532,700 | $309,100 | $223,600 |
| 2021 | $6,058 | $513,400 | $309,100 | $204,300 |
| 2020 | $5,920 | $513,400 | $309,100 | $204,300 |
| 2019 | $5,912 | $500,600 | $309,100 | $191,500 |
| 2018 | $5,471 | $464,800 | $228,300 | $236,500 |
| 2017 | $5,009 | $408,900 | $180,900 | $228,000 |
| 2016 | $4,952 | $396,500 | $172,300 | $224,200 |
| 2015 | $4,748 | $378,900 | $164,100 | $214,800 |
Source: Public Records
Map
Nearby Homes
- 2 Cliff Rd
- 166 Hull St
- 114 Hull St
- LOT 1B Rockland St
- 23 Wyola Rd
- 155 George Washington Blvd Unit 210
- 99 Nantasket Ave
- 22 Berkley Rd Unit B
- 121 Nantasket Ave Unit 503
- 101 Rockland St
- 4 Atherton Rd
- 1 Longbeach Ave Unit 202
- 9 Park Ave Unit 202
- 6 State Park Rd Unit 2
- 62 Oceanside Dr
- 8 Evergreen Ln
- 181 Atlantic Ave
- 112 Martins Ln
- 3 Evergreen Ln
- 1 Rockland St
- 9 Meadow Rd
- 3 Cliff Rd
- 7 Meadow Rd
- 6 Chestnut Rd
- 6 Chestnut Place
- 10 Cliff Rd
- 2 Chestnut Place
- 258 Rockland St
- 11 Cliff Rd
- 10 Chestnut Rd
- 4 Chestnut Place
- 252 Rockland St
- 246 Rockland St
- 15 Cliff Rd
- 20 Bonnie Brier Cir
- 16 Bonnie Brier Cir
- 8 Chestnut Place
- 17 Cliff Rd
- 14 Chestnut Rd
- 14 Bonnie Brier Cir
Your Personal Tour Guide
Ask me questions while you tour the home.