13 Meta Dr Swansea, IL 62226
Estimated Value: $171,960 - $210,000
--
Bed
--
Bath
1,446
Sq Ft
$131/Sq Ft
Est. Value
About This Home
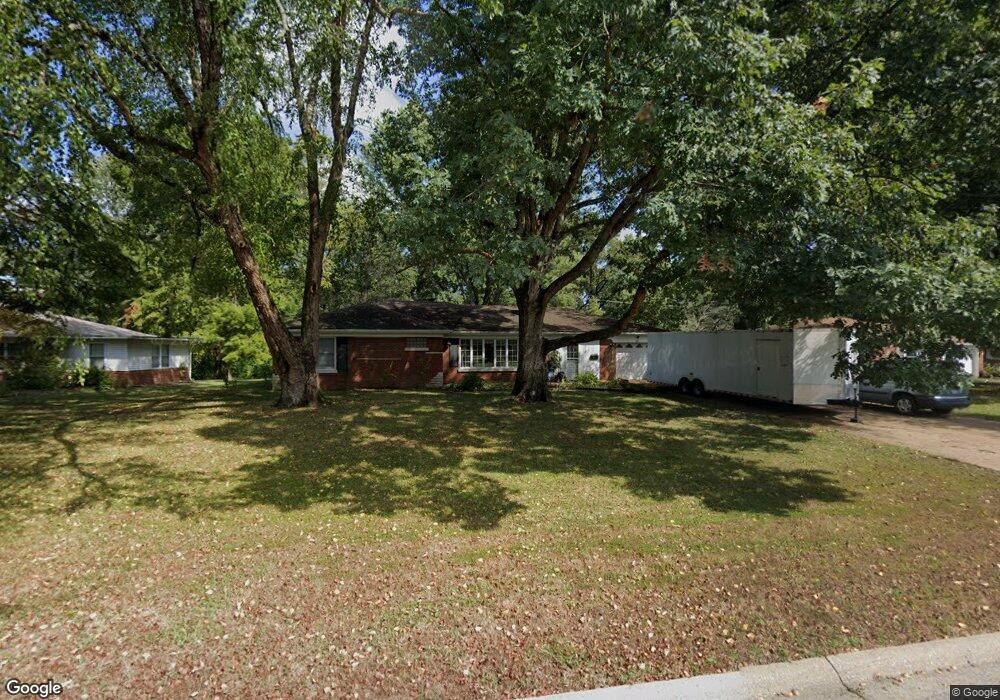
This home is located at 13 Meta Dr, Swansea, IL 62226 and is currently estimated at $189,490, approximately $131 per square foot. 13 Meta Dr is a home located in St. Clair County with nearby schools including High Mount Elementary School, Governor French Academy, and Notre Dame Academy of Belleville.
Ownership History
Date
Name
Owned For
Owner Type
Purchase Details
Closed on
Feb 28, 2014
Sold by
Rayfield Harry W
Bought by
Rayfield Harry W and Rayfield Harry Gray
Current Estimated Value
Home Financials for this Owner
Home Financials are based on the most recent Mortgage that was taken out on this home.
Original Mortgage
$110,907
Outstanding Balance
$84,223
Interest Rate
4.39%
Mortgage Type
FHA
Estimated Equity
$105,267
Purchase Details
Closed on
Jul 22, 2011
Sold by
Rayfield Harry G
Bought by
Rayfield Harry W
Home Financials for this Owner
Home Financials are based on the most recent Mortgage that was taken out on this home.
Original Mortgage
$82,530
Interest Rate
4.52%
Mortgage Type
New Conventional
Create a Home Valuation Report for This Property
The Home Valuation Report is an in-depth analysis detailing your home's value as well as a comparison with similar homes in the area
Home Values in the Area
Average Home Value in this Area
Purchase History
| Date | Buyer | Sale Price | Title Company |
|---|---|---|---|
| Rayfield Harry W | -- | First Title & Escrow | |
| Rayfield Harry W | $150,000 | None Available |
Source: Public Records
Mortgage History
| Date | Status | Borrower | Loan Amount |
|---|---|---|---|
| Open | Rayfield Harry W | $110,907 | |
| Closed | Rayfield Harry W | $82,530 |
Source: Public Records
Tax History Compared to Growth
Tax History
| Year | Tax Paid | Tax Assessment Tax Assessment Total Assessment is a certain percentage of the fair market value that is determined by local assessors to be the total taxable value of land and additions on the property. | Land | Improvement |
|---|---|---|---|---|
| 2024 | $3,560 | $54,188 | $5,702 | $48,486 |
| 2023 | $3,092 | $47,158 | $5,624 | $41,534 |
| 2022 | $2,831 | $42,949 | $5,122 | $37,827 |
| 2021 | $2,739 | $41,186 | $4,912 | $36,274 |
| 2020 | $2,601 | $38,356 | $4,574 | $33,782 |
| 2019 | $2,562 | $39,101 | $4,667 | $34,434 |
| 2018 | $2,538 | $38,103 | $4,548 | $33,555 |
| 2017 | $2,456 | $37,089 | $4,427 | $32,662 |
| 2016 | $2,446 | $35,810 | $4,274 | $31,536 |
| 2014 | $1,916 | $33,826 | $4,260 | $29,566 |
| 2013 | $2,730 | $33,826 | $4,260 | $29,566 |
Source: Public Records
Map
Nearby Homes