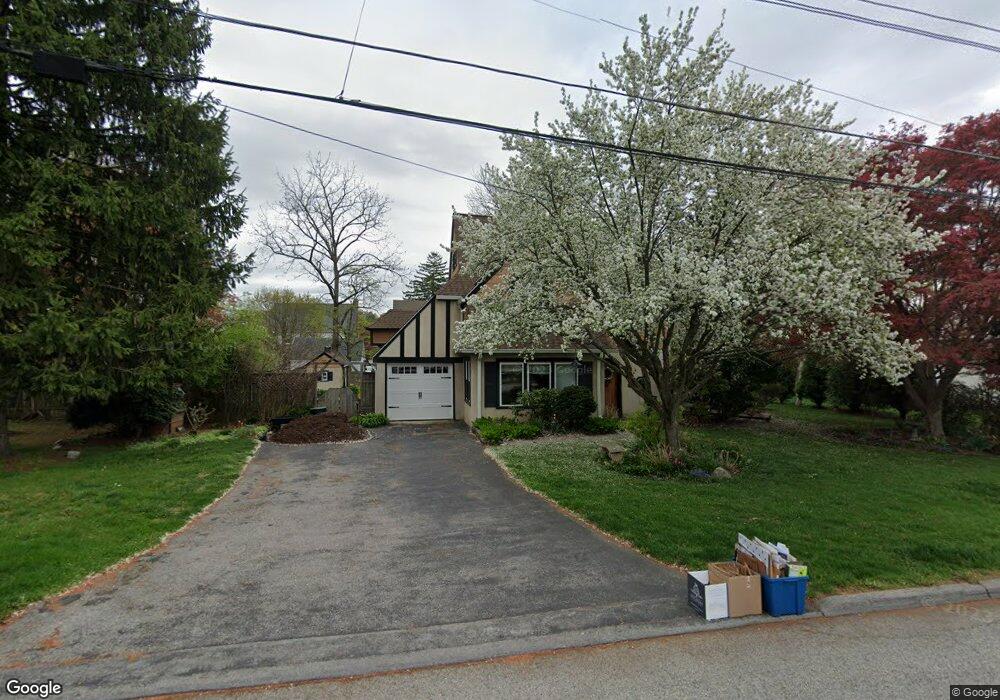
13 Mohawk Rd Ossining, NY 10562
Estimated Value: $716,000 - $851,000
3
Beds
3
Baths
2,224
Sq Ft
$363/Sq Ft
Est. Value
About This Home
This home is located at 13 Mohawk Rd, Ossining, NY 10562 and is currently estimated at $806,607, approximately $362 per square foot. 13 Mohawk Rd is a home located in Westchester County with nearby schools including Park School, Roosevelt Elementary School, and Brookside Elementary School.
Ownership History
Date
Name
Owned For
Owner Type
Purchase Details
Closed on
Sep 16, 2011
Sold by
Wasilenko John and Kelly Kathryn M
Bought by
Fendrich Clark and May Fendrich Heike
Current Estimated Value
Home Financials for this Owner
Home Financials are based on the most recent Mortgage that was taken out on this home.
Original Mortgage
$384,300
Outstanding Balance
$264,045
Interest Rate
4.33%
Mortgage Type
New Conventional
Estimated Equity
$542,562
Purchase Details
Closed on
Jan 15, 2003
Sold by
Langille Robert and Langille Ann
Bought by
Wasilenko John and Kelly Kathryn M
Home Financials for this Owner
Home Financials are based on the most recent Mortgage that was taken out on this home.
Original Mortgage
$322,700
Interest Rate
5.95%
Mortgage Type
Purchase Money Mortgage
Create a Home Valuation Report for This Property
The Home Valuation Report is an in-depth analysis detailing your home's value as well as a comparison with similar homes in the area
Home Values in the Area
Average Home Value in this Area
Purchase History
| Date | Buyer | Sale Price | Title Company |
|---|---|---|---|
| Fendrich Clark | $427,000 | None Available | |
| Wasilenko John | $460,000 | Access Title Ins Agency Inc |
Source: Public Records
Mortgage History
| Date | Status | Borrower | Loan Amount |
|---|---|---|---|
| Open | Fendrich Clark | $384,300 | |
| Previous Owner | Wasilenko John | $322,700 |
Source: Public Records
Tax History
| Year | Tax Paid | Tax Assessment Tax Assessment Total Assessment is a certain percentage of the fair market value that is determined by local assessors to be the total taxable value of land and additions on the property. | Land | Improvement |
|---|---|---|---|---|
| 2024 | $19,567 | $613,300 | $181,800 | $431,500 |
| 2023 | $18,389 | $568,200 | $181,800 | $386,400 |
| 2022 | $18,149 | $505,100 | $181,800 | $323,300 |
| 2021 | $15,955 | $450,900 | $181,800 | $269,100 |
| 2020 | $16,489 | $450,900 | $181,800 | $269,100 |
| 2019 | $16,158 | $439,500 | $173,200 | $266,300 |
| 2018 | $15,678 | $426,800 | $173,200 | $253,600 |
| 2017 | $8,808 | $422,600 | $173,200 | $249,400 |
| 2016 | $161,946 | $422,600 | $173,200 | $249,400 |
| 2015 | $11,208 | $23,715 | $7,000 | $16,715 |
| 2014 | $11,208 | $23,715 | $7,000 | $16,715 |
| 2013 | $11,208 | $23,715 | $7,000 | $16,715 |
Source: Public Records
Map
Nearby Homes
Your Personal Tour Guide
Ask me questions while you tour the home.