Estimated Value: $482,000 - $497,000
2
Beds
1
Bath
688
Sq Ft
$712/Sq Ft
Est. Value
About This Home
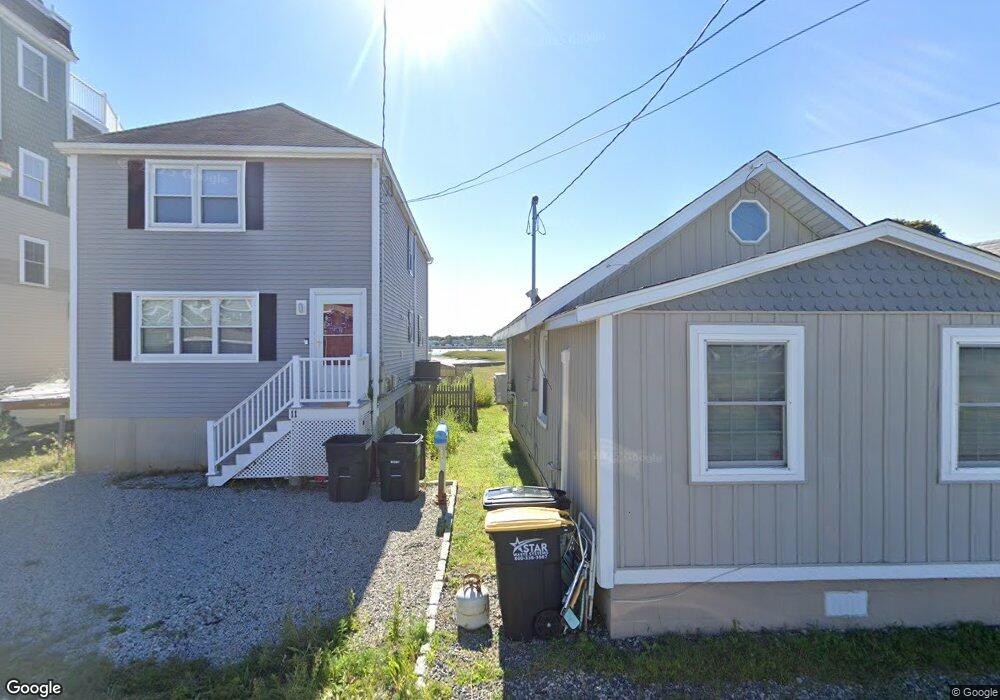
This home is located at 13 Moreland Ave Unit 1, Hull, MA 02045 and is currently estimated at $489,598, approximately $711 per square foot. 13 Moreland Ave Unit 1 is a home located in Plymouth County with nearby schools including Lillian M. Jacobs Elementary School, Memorial Middle School, and Hull High School.
Ownership History
Date
Name
Owned For
Owner Type
Purchase Details
Closed on
Jun 6, 2025
Sold by
Dalrymple John C and Dalrymple Kerri
Bought by
Provost Timothy A and Provost Christina M
Current Estimated Value
Home Financials for this Owner
Home Financials are based on the most recent Mortgage that was taken out on this home.
Original Mortgage
$392,000
Outstanding Balance
$390,796
Interest Rate
5.88%
Mortgage Type
Purchase Money Mortgage
Estimated Equity
$98,802
Purchase Details
Closed on
Jun 1, 2022
Sold by
Dalrymple Kerri
Bought by
Dalrymple John C and Dalrymple Kerri
Home Financials for this Owner
Home Financials are based on the most recent Mortgage that was taken out on this home.
Original Mortgage
$318,750
Interest Rate
5.09%
Mortgage Type
Stand Alone Refi Refinance Of Original Loan
Purchase Details
Closed on
May 16, 2022
Sold by
Caulfield Jennifer
Bought by
Darlrymple Kerri
Home Financials for this Owner
Home Financials are based on the most recent Mortgage that was taken out on this home.
Original Mortgage
$318,750
Interest Rate
5.09%
Mortgage Type
Stand Alone Refi Refinance Of Original Loan
Purchase Details
Closed on
Oct 15, 2021
Sold by
Riley John E
Bought by
Caulfield Jennifer
Home Financials for this Owner
Home Financials are based on the most recent Mortgage that was taken out on this home.
Original Mortgage
$315,000
Interest Rate
2.8%
Mortgage Type
Purchase Money Mortgage
Purchase Details
Closed on
Sep 5, 2017
Sold by
Baggett Sean P and Baggett Samantha A
Bought by
Riley John E
Home Financials for this Owner
Home Financials are based on the most recent Mortgage that was taken out on this home.
Original Mortgage
$283,765
Interest Rate
3.96%
Mortgage Type
FHA
Purchase Details
Closed on
Sep 4, 2015
Sold by
Cerilli Scott E and Cerilli Lisa K
Bought by
Baggett Sean P and Mahoney Samantha A
Purchase Details
Closed on
Sep 5, 2003
Sold by
Connolly Richard S
Bought by
Cerilli Scott E and Cerilli Lisa K
Purchase Details
Closed on
Sep 29, 1995
Sold by
Gundolfi Michael
Bought by
Connolly Richard S
Create a Home Valuation Report for This Property
The Home Valuation Report is an in-depth analysis detailing your home's value as well as a comparison with similar homes in the area
Home Values in the Area
Average Home Value in this Area
Purchase History
| Date | Buyer | Sale Price | Title Company |
|---|---|---|---|
| Provost Timothy A | $490,000 | None Available | |
| Provost Timothy A | $490,000 | None Available | |
| Dalrymple John C | -- | None Available | |
| Dalrymple John C | -- | None Available | |
| Dalrymple John C | -- | None Available | |
| Darlrymple Kerri | $399,000 | None Available | |
| Darlrymple Kerri | $399,000 | None Available | |
| Darlrymple Kerri | $399,000 | None Available | |
| Caulfield Jennifer | $350,000 | None Available | |
| Caulfield Jennifer | $350,000 | None Available | |
| Caulfield Jennifer | $350,000 | None Available | |
| Riley John E | $289,000 | -- | |
| Riley John E | $289,000 | -- | |
| Baggett Sean P | $215,000 | -- | |
| Baggett Sean P | $215,000 | -- | |
| Cerilli Scott E | $215,500 | -- | |
| Connolly Richard S | $59,200 | -- | |
| Riley John E | $289,000 | -- | |
| Baggett Sean P | $215,000 | -- | |
| Cerilli Scott E | $215,500 | -- | |
| Connolly Richard S | $59,200 | -- |
Source: Public Records
Mortgage History
| Date | Status | Borrower | Loan Amount |
|---|---|---|---|
| Open | Provost Timothy A | $392,000 | |
| Closed | Provost Timothy A | $392,000 | |
| Previous Owner | Dalrymple John C | $318,750 | |
| Previous Owner | Darlrymple Kerri | $319,000 | |
| Previous Owner | Caulfield Jennifer | $315,000 | |
| Previous Owner | Riley John E | $283,765 |
Source: Public Records
Tax History Compared to Growth
Tax History
| Year | Tax Paid | Tax Assessment Tax Assessment Total Assessment is a certain percentage of the fair market value that is determined by local assessors to be the total taxable value of land and additions on the property. | Land | Improvement |
|---|---|---|---|---|
| 2025 | $4,586 | $409,500 | $201,600 | $207,900 |
| 2024 | $4,462 | $383,000 | $188,200 | $194,800 |
| 2023 | $4,511 | $370,700 | $188,200 | $182,500 |
| 2022 | $3,318 | $264,600 | $177,400 | $87,200 |
| 2021 | $3,137 | $247,400 | $161,300 | $86,100 |
| 2020 | $3,038 | $237,000 | $155,900 | $81,100 |
| 2019 | $2,955 | $226,400 | $150,600 | $75,800 |
| 2018 | $2,918 | $217,400 | $150,600 | $66,800 |
| 2017 | $2,910 | $212,100 | $150,600 | $61,500 |
| 2016 | $2,914 | $216,200 | $150,600 | $65,600 |
| 2015 | $3,014 | $216,200 | $150,600 | $65,600 |
| 2014 | $2,720 | $196,100 | $134,400 | $61,700 |
Source: Public Records
Map
Nearby Homes
- 134 Hampton Cir
- 14 Standish Rd
- 15 Lincoln Ave
- 67 Hampton Cir
- 92 Hampton Cir
- 61 Barnstable Rd
- 68 Edgewater Rd
- 67 Whitehead Ave
- 15 2nd St
- 15 Park Ave Unit 307
- 2 6th St
- 155 Nantasket Ave Unit B402
- 22 Berkley Rd Unit C
- 22 Berkley Rd Unit B
- 4 Atherton Rd
- 19 Berkley Rd
- 40 Rockaway Ave
- 20 Rockland House Rd Unit 203
- 23 Wyola Rd
- 120 Nantasket Ave Unit 304
- 13 Moreland Ave
- 15 Moreland Ave
- 11 Moreland Ave August Unit summer
- 11 Moreland Ave
- 11 Moreland Ave
- 11 Moreland Ave Unit summer
- 11 Moreland Ave Unit winter rent
- 11 Moreland Ave Winter Rntl Unit seasonal
- 11 Moreland Avenue August Unit summer
- 11 Moreland Ave Sept-May Unit winter
- 11 Moreland Ave July Or Aug Unit summer
- 11 Moreland Ave July Only Unit summer
- 17 Moreland Ave
- 9 Moreland Ave
- 9 Moreland Ave
- 1 Hampton Cir
- 7 Moreland Ave Unit 1
- 7 Moreland Ave
- 11 Moreland Ave-Waterfront
- 3 Hampton Cir