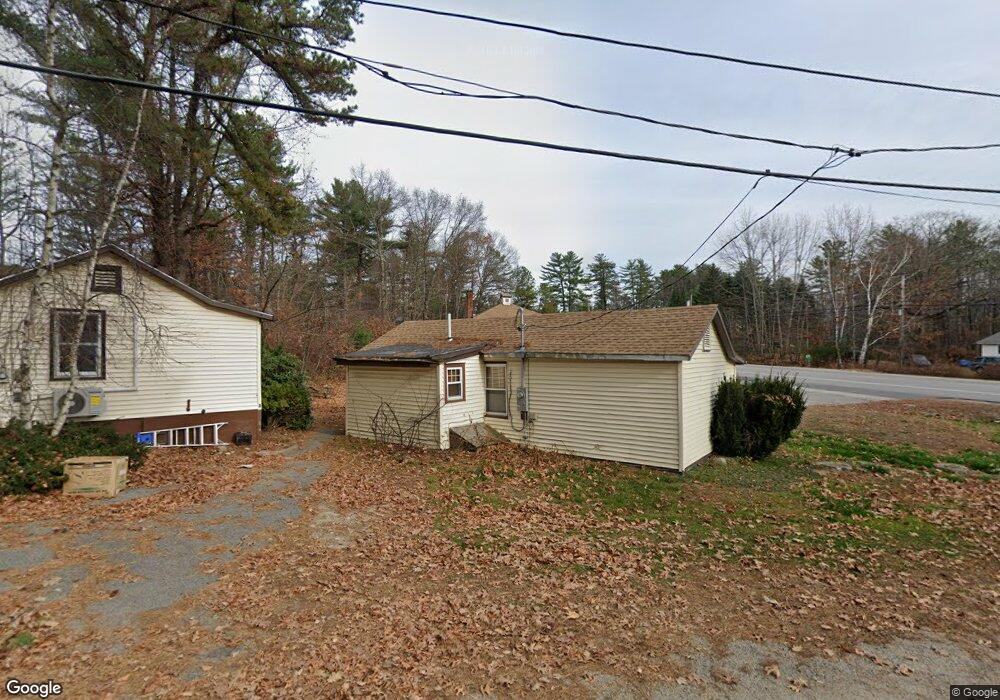
13 Mt View St Windham, ME 04062
Estimated Value: $308,000 - $464,438
1
Bed
2
Baths
972
Sq Ft
$429/Sq Ft
Est. Value
About This Home
This home is located at 13 Mt View St, Windham, ME 04062 and is currently estimated at $416,610, approximately $428 per square foot. 13 Mt View St is a home located in Cumberland County with nearby schools including Manchester School, Windham Primary School, and Windham Middle School.
Ownership History
Date
Name
Owned For
Owner Type
Purchase Details
Closed on
May 30, 2017
Sold by
Flynn Robert E
Bought by
Kimball David
Current Estimated Value
Purchase Details
Closed on
Jul 16, 2013
Sold by
Presley Cheryl J Est
Bought by
Flynn Robert V and Flynn Julie L
Home Financials for this Owner
Home Financials are based on the most recent Mortgage that was taken out on this home.
Original Mortgage
$109,800
Outstanding Balance
$78,230
Interest Rate
3.83%
Mortgage Type
New Conventional
Estimated Equity
$338,380
Create a Home Valuation Report for This Property
The Home Valuation Report is an in-depth analysis detailing your home's value as well as a comparison with similar homes in the area
Home Values in the Area
Average Home Value in this Area
Purchase History
| Date | Buyer | Sale Price | Title Company |
|---|---|---|---|
| Kimball David | -- | -- | |
| Flynn Robert V | -- | -- |
Source: Public Records
Mortgage History
| Date | Status | Borrower | Loan Amount |
|---|---|---|---|
| Open | Flynn Robert V | $109,800 |
Source: Public Records
Tax History
| Year | Tax Paid | Tax Assessment Tax Assessment Total Assessment is a certain percentage of the fair market value that is determined by local assessors to be the total taxable value of land and additions on the property. | Land | Improvement |
|---|---|---|---|---|
| 2025 | $4,035 | $334,600 | $75,800 | $258,800 |
| 2024 | $3,838 | $334,600 | $75,800 | $258,800 |
| 2023 | $3,546 | $316,600 | $70,500 | $246,100 |
| 2022 | $3,237 | $278,800 | $62,400 | $216,400 |
| 2021 | $2,887 | $229,100 | $54,300 | $174,800 |
| 2020 | $2,468 | $189,500 | $47,600 | $141,900 |
| 2019 | $2,774 | $189,500 | $47,600 | $141,900 |
| 2018 | $2,553 | $168,200 | $42,800 | $125,400 |
| 2017 | $2,361 | $143,700 | $38,400 | $105,300 |
| 2016 | $2,256 | $143,700 | $38,400 | $105,300 |
| 2015 | $2,177 | $143,700 | $38,400 | $105,300 |
| 2014 | $2,108 | $143,700 | $38,400 | $105,300 |
| 2013 | $1,620 | $112,100 | $38,400 | $73,700 |
Source: Public Records
Map
Nearby Homes
- 1083 Roosevelt Trail
- 1112 Roosevelt Trail Unit 8
- 1042 Roosevelt Trail
- 20 Bittersweet Way
- lot #8 Bedrock Terrace
- 99 Enterprise Dr
- 18 Hillside Dr
- 96 Mineral Spring Rd
- 16 Peterson Rd
- 11 Clover Ln
- 34 Trails End Rd
- 72 Sand Beach Rd
- 34 Many Oaks Ln
- Lot #1 Chamberlain Dr
- 103 Basin Rd
- 194 Hearthside Rd
- 2 Flynn Rd
- 10 Abby Rd
- 1 Matinicus Way Unit 1
- 14 Sabbady Point Rd
- 13 Mountain View St
- 15 Mt View St
- 15 Mt View St
- 15 Mountain View St
- 57 Crescent Ave
- 53 Crescent Ave
- 1092 Roosevelt Trail
- 51 Crescent Ave
- 1088 Roosevelt Trail
- 47 Crescent Ave
- 1094 Roosevelt Trail
- 56 Crescent Ave
- 60 Crescent Ave
- 62 Crescent Ave
- 54 Crescent Ave
- 1089 Roosevelt Trail
- 1096 Roosevelt Trail
- 8 Crescent Ave
- 50 Crescent Ave
- 1087 Roosevelt Trail
Your Personal Tour Guide
Ask me questions while you tour the home.